
The month of April 2018 saw an increase in the average SA electricity pool price due to a number of high price spikes on the 26th April. The average was $98.37/MWh for the month compared with the previous month of March at $80.70/MWh.
As an end-user exposed to the pool price, with the ability to curtail load in the event of high price spikes, we are interested in the underlying half-hour spot price action and not just average monthly prices. We also want to know what is driving the price spikes so that we can be prepared for them.
A great way of understanding half-hour price action volatility and trend over time is to use box plots. Box plots capture all of the price action so that the data can be easily visually compared to examine price volatility, price level and longer-term trends.
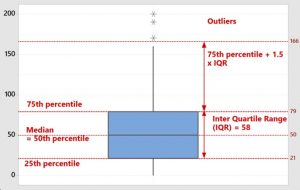
The chart below shows a typical box plot for just one period. The body of the box represents the 25th to the 75th percentile of the data with a horizontal line within the box indicating the median value. The whiskers, either side, contain the minimum and maximum data or up to a maximum of 1.5 times the Inter Quartile Range (IQR) above the 75th percentile and below the 25th percentile. Any data outside 1.5 times the IQR from the solid box are regarded as outliers, or “special causes” that are not typical of the underlying data distribution.
The chart below shows the box plot distribution for half hourly prices by month for the period July 2014 until April 2018 excluding the outliers. We can exclude the outliers from the chart, at this stage, as we are analysing the underlying data distribution of typical price data. However, the red trend line indicates the monthly average price. If the average is well above the median (the horizontal line) and or even the solid box, this will indicate a number of high price spikes, or outliers, that have dragged the average up. This was the case in April 2018.
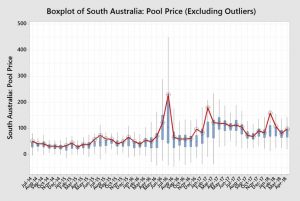
The chart shows the monthly price distribution over almost 4-years and shows the impact of the Northern Power station closure in May 2016, the recommissioning of Pelican Point Closed Circuit Gas Turbine (CCGT) in August 2016 and the closure of the coal fired Hazelwood Power Station in Victoria in February 2017. January 2018 was characterised by very hot weekdays with low wind generation.
So what drove the high prices spikes on the 26th April 2018 that caused the daily average to jump to $405.13/MWh?
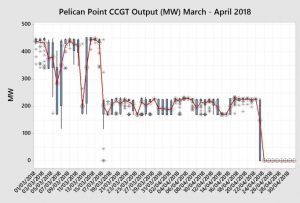
By analysing the behaviour of the generators through doing box plots of half-hour generation output we can see some of the drivers of the price outcomes. On 19th March 2018, the Pelican Point CCGT reduced output by 50% and then completely shutdown on 23rd April. Remember that this power station was the one that delivered lower prices to South Australians by recommissioning in August 2016.
But this alone did not cause prices to rise, as the average daily spot price on the 25th was $89.65/MW.
With the major base-load CCGT generator being off, the state was obviously much more susceptible to fluctuations in wind generation. So what was happening with wind generation over this period?
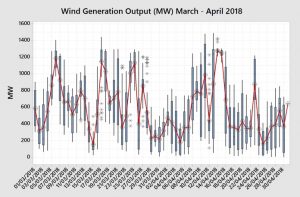
The chart below shows the box plot for wind generation output by day over March and April. The wind did drop off substantially on the 26th April, but it was even lower on the 25th on a day that had modest prices.
So what was it that caused SA pool prices to spike on the 26th?
The chart below shows the interconnector flows between VIC and SA and the corresponding SA pool price at the time. All of this flow was through the Heywood Interconnector as the smaller Murraylink Interconnector was down. It can be seen that SA was importing around 400 MW of electricity and that suddenly dropped to zero between 11:30 and midday. Prices did jump in the preceding half-hour period, which was likely due to the interconnector being constrained in the latter 5-minute increments of the preceding half-hour.
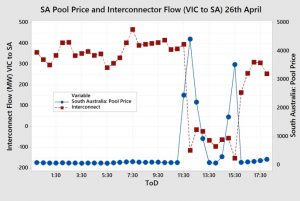
So a loss of 400 MW of supply through the interconnector, at a time when both units at Pelican Point (450 MW capacity) were offline, was the driver of the higher prices.
Let’s have a look at what the generation mix looked like during this period.
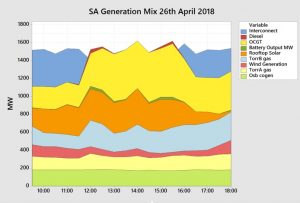
Osborne and Torrens A were very steady during the whole day with Torrens A picking up a little when the Interconnector dropped out. Despite wind generation being quite low it was reasonably steady before, during and after this period. Torrens B ramped up when the Interconnector dropped off and the more expensive Open cycle Gas Turbines (OCGT) significantly increased generation. The big battery kicked in as did the very expensive diesel fired generator nestled within the vineyards in the Barossa Valley. It was diesel generation that set the very high price.
So how does all of this information help an end user exposed to wholesale pool (spot) prices? By monitoring the behaviour of the generators, the status of the interconnectors and forecast wind strengths, the end user can make informed decisions as to whether to schedule plant maintenance in advance, get ready to curtail at short notice or have confidence to push-through during forecast price volatility. It may allow them to achieve monthly prices closer to the median (in the middle of the box) rather than the average price.
My new book Power Profits examines how the market operates and how end users can take advantage of that knowledge. It provides a comprehensive 9-step framework for reducing electricity costs and boosting business profits.
If you would like to learn more, check out the book here, available in hard copy or as a Kindle Ebook.