
In early February I wrote this article about the electricity cost tsunami hitting SA businesses and what they could do to avoid the enormous price increases. I followed this up this month with a review of what January and February would have delivered a spot-exposed business in SA, in terms of benefits.
I received a lot of feedback about these articles including questions as to what the minimum load threshold for this strategy to be effective is and would it be possible to make similar savings in other states.
In terms of threshold, a business with a total annual consumption of 3GWh or more would certainly benefit from this strategy. This may include businesses with a peak demand of around 500 kW or more. Smaller loads would also benefit but the returns might not be large enough to generate strong interest.
In this article I will focus on the opportunity in Queensland after having a brief view of what has happened with spot prices nationally.

Table 1 – Financial Year Average Annual Spot Prices by Region
Source: http://www.aemo.com.au/Electricity/Data/Price-and-Demand/Average-Price-Tables/Average-Price-Tables-Annual
Table 1 above shows the financial year annual average market spot prices for all of the NEM regions. There is volatility evident from year-to-year but it can be seen that pre Carbon Tax average prices were around the $30-$40/MWh mark or 3-4c/kWh in most regions. In Queensland, in the decade preceding the carbon tax, eight out of ten years had pricing in the 3-4c/kWh range. After the Carbon Tax repeal the different regions have diverged in price, each with their own set of issues. I have already written about SA here and will now have a closer look at what is happening in Queensland.
A good way to visualise the distribution of prices is to represent them on a “Box Plot”.
A box plot is a way of displaying the distribution of data based on a five number summary: minimum, first quartile, median, third quartile, and maximum. In the box plot the central rectangle spans the first quartile to the third quartile (the Interquartile Range or IQR). A horizontal line inside the rectangle shows the median and “whiskers” above and below the box show the locations of the minimum and maximum.
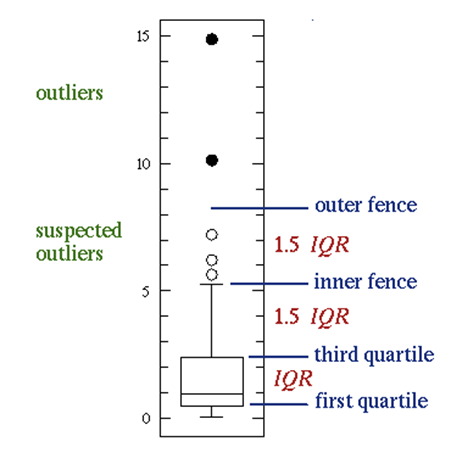
Figure 1 – Diagrammatical Representation of a Box Plot
Source: http://www.physics.csbsju.edu/stats/box2.html
Data will usually display surprisingly high maximums or surprisingly low minimums called outliers. Outliers are defined as either 3×IQR or more above the third quartile or 3×IQR or more below the first quartile. Suspected outliers are slightly more central versions of outliers: either 1.5×IQR or more above the third quartile or 1.5×IQR or more below the first quartile. If either type of outlier is present the whisker on the appropriate side is taken to 1.5×IQR from the quartile rather than the maximum or minimum.
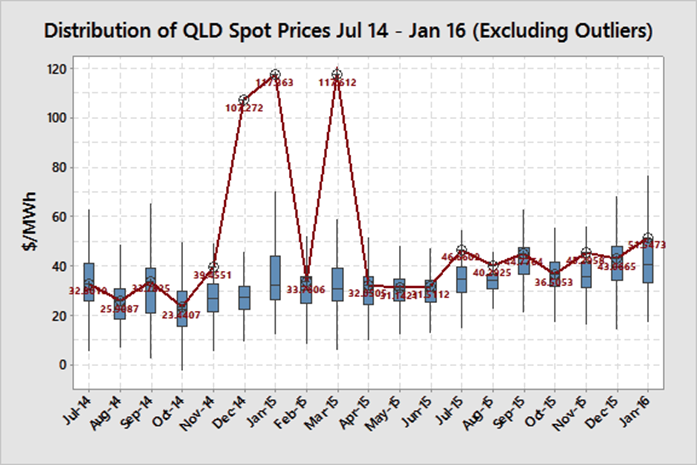
Figure 2 – Monthly Distribution of QLD Half-hour Spot Prices
(Data Source: NEM-Review)
Figure 2 shows a Box Plot of the distribution of half-hourly spot prices in Queensland from July-14 to January-16. As the potential range of spot prices spans nearly $15,000 (from -$1,000/MWh to $13,800/MWh) but most price data points are below $100, the outliers are omitted from the graphical display. The effect of these outliers is shown in the average prices listed in red.
As can be seen, if spot price outliers are present, they will move the average well above the median price and sometimes the whole box range.
The 12-month average spot prices in the Queensland region have been around the $52/MWh (5.2 c/kWh) over the last 19-months whilst most average monthly prices have been significantly below that. There have been some significant price spikes in Dec-14, Jan-15, Mar-15 and Feb-16 (not shown) that have dragged the average monthly price well above the typical distribution. See here for a discussion about how upstream electric compression at the gas fields for LNG export combined with El Nino hot weather are driving higher summer demand in Queensland.
Typical flat retail price offers for Queensland for the 2015-2016 period have been around the 4.75 c/kWh mark and so have been fairly valued compared with the actual average spot prices of 5.2 c/kWh. A consumer with little ability or desire to curtail load during high price events would likely be better off on a fixed retail price (as opposed to SA where they would still be likely to make considerable savings if they were exposed to the pool – see previous article about the SA market).
Potential benefits of Demand Response (DR)
Would a consumer who has the ability to curtail load during high price events be better off taking a pool price pass-through and DSM approach or sticking with fixed retail prices?
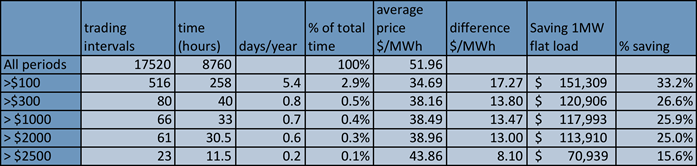
Table 2 – 2015 QLD Price Frequency Analysis
(Data Source: NEM-Review)
Table 2 shows the frequency of different threshold price intervals over the 2015 calendar year. The number of half-hour periods exceeding $100/MWh (10 c/kWh) was 516 for the full year. Had a business been willing and able to curtail load if spot prices exceeded $100 they would have saved up to 33%* in cost versus the spot price and achieved an average price of $34.69/MWh (3.5 c/kWh). However they would have lost the equivalent of 258 hours of production.
(a) For a factory that is running at near capacity this downtime would likely not have been acceptable.
(b) If the factory was not running at full capacity the downtime would have had no material effect but the significant cost savings would have gone straight to the bottom line.
A business that was willing and able to curtail but did not want to shut down some or all of their operations for that period of time could choose a different price threshold to curtail load. If the business chooses $1,000 as the curtailment threshold then they would have shut down for a total duration of 33 hours over the whole of 2015 or 0.7 days. This would have reduced their annual availability by a small 0.4% but achieved an annual average price of $38.49/MWh (3.8 c/kWh).
So how would they have fared compared with a typical retail offer?

Table 3 – Curtailment Savings for a 1 MW Flat Load
Table 3 shows the annual savings for a flat 1 MW load with perfect load curtailment and perfect forecasting. The factory with the underutilised capacity and curtailing at $100 would have saved $112,000 compared with the typical retail pricing. The factory that curtailed at $1,000 would have saved $79,000 for the year compared with the typical fixed retail price.
A flat 10 MW load would have saved $1.12m with a $100 threshold and $790,000 with a $1,000 threshold.
It is evident that there are significant electricity cost savings to be made in Queensland by adopting a pool price pass-through approach along with a Demand Response (DR) strategy.
Setting Up A Pool Price Pass-through and DR Strategy
Before embarking on a pool price pass-through arrangement it is important to understand how the market operates, the opportunities, the risks and your own constraints. It is also critical to educate any staff and employees that are involved.
All businesses are different.
(a) Some operate 24/7 and any small disruption has a high opportunity cost.
(b) Some businesses operate all of their equipment well under capacity and are not sensitive at all to short stops.
Most are in between.
It is important to do a study on all of the major equipment, determine which equipment are bottlenecks (constraints), which are utilised below full capacity, the implications of shutting down a constrained asset for a short period of time and the consequential break-even cost of shutting down. Some equipment cannot be shutdown at all, other equipment can only be shut down if stocks allow.
From this analysis a load-shedding schedule can be constructed with a list of equipment to be shut down at different price thresholds. Some of these may have discretionary actions dependent on product stock levels or actions may require escalation for approval prior to shutting down. Some businesses may choose to shut all equipment down at one price level, some will have different levels for different assets and some may choose not to shut down at all.
When constructing the load-shedding schedule it is necessary to have an understanding of the likely number of curtailment events and the duration of those events.
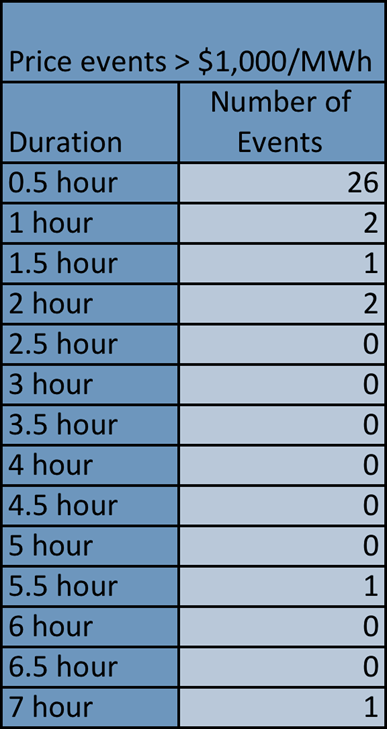
Table 4 – 2015 QLD Price Event Frequency
Table 4 shows the frequency and duration of high price events in QLD in 2015 exceeding $1,000. Nearly 80% of the events were just one half-hour. It is important to note however that there were two very long duration events, one being 5.5 hours and the other being 7 hours.
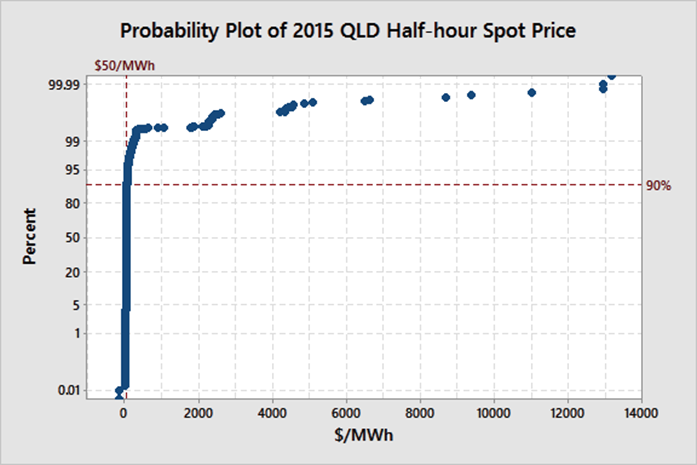
Figure 3 – Probability distribution Plot of 2015 QLD Half-hour spot Prices
Figure 3 shows a probability plot of actual half-hour spot prices for 2015. It clearly shows the small number of high price intervals compared with the bulk of the prices. 90% of all prices sit below $50/MWh.
Most businesses that I work with initially believe that they have no ability to curtail load.
When their load data is analysed though it is clear that they are frequently curtailing load for many other reasons such as meal breaks, scheduled maintenance, full stocks, product changeovers, shift changeovers, clean-ups, inspections, meetings, training etc. The level of curtailment as a percentage of time for these other reasons far outweighs the curtailment time required for a DSM strategy.
Another question that is frequently asked is what are they going to do with the operators when the plant is curtailed. The answer is that it provides a great opportunity to do all of the things that people never seem to have the time to do including team meetings, tool box meetings, communication sessions, clean ups and even training if a whole afternoon of high prices are expected.
The ability to curtail load in the event of high prices is often much greater than businesses first realise and the rewards are enormous.
Real time, accurate market information is crucial to a DSM strategy.
(a) NEM-Watch is a great tool that enables the operations staff to monitor the market, prepare for high price events and get alerts in the event of sudden high price events. It provides the big picture in what is happening across the entire network and a detailed picture of what is happening in the hub that the business is operating in with regards to forecast and actual demand and price and generation mix including wind and solar PV.
(b) A number of energy users who have operated in this way for a number of years choose to use the deSide software for effective warning, and ease of control of their Demand Response.
Load Planning
DSM not only involves a strategy to react to high price events but also incudes planning ahead to shift load to periods that are expected to have lower prices and avoiding running maximum load during periods that are expected to have high prices.
This can include organising scheduled shutdowns in periods that have a higher likelihood of high prices. Figure 4 shows that high price events in Queensland occurred largely in the warmer months of November through to March during the 2014-2015 period.
Major shutdowns should be planned for those months where possible.

Figure 4: High Price events in QLD > $100/MWh By Month of Year 2014-2015
Figure 5 shows typical price distributions by time-of-day over the 2015 period (excluding outliers). By maximising load during the night and minimising load during the day, particularly late afternoon and early evening the average price can be reduced. Scheduling short maintenance outages on major equipment in the afternoons rather than back shifts can help achieve that outcome. Businesses that pump water such as irrigators or water utilities can schedule their pumping for these lower price periods. Any guess what time most people wake up? What about get home from work?
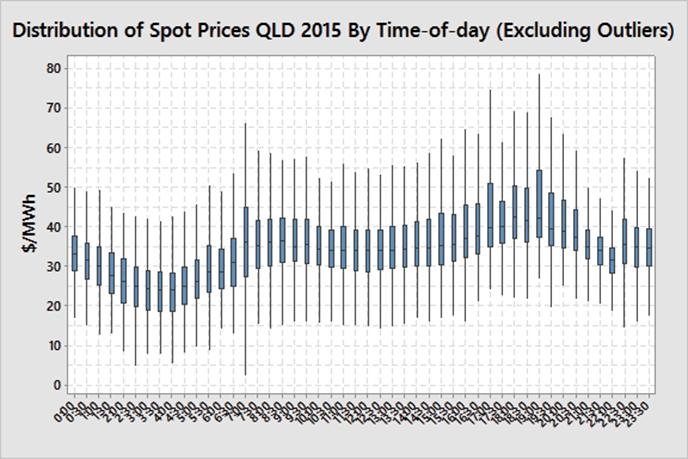
Figure 5 – Price distribution By Time of Day
(Data Source: NEM-Review)
Call To Action
Pool exposure and DSM is not for all businesses.
In Queensland the benefit largely goes to those consumers who are willing and able to curtail load in the event of high prices. Some businesses require absolute certainty in their cost inputs even if they are at a higher price. For some the savings may be too small to spend time and resources in setting it up. Others may not be able to tolerate the risk or potential fluctuations in monthly bills.
For those businesses with significant electricity spend and are in the relentless pursuit of finding cost savings then a pool pass-through arrangement coupled with a DSM strategy may deliver significant savings.
DSM response of a level of up to 345 MW has been observed in Queensland during periods of high prices indicating that smart businesses are already using this strategy.
If you are interested in employing a pool/DSM strategy to reduce costs and wanting to get a better understanding of the risks and potential rewards then contact me at michael@altusenergy.com.au.
Notes:
* This analysis assumes that all high price events were forecast and the user was able to curtail immediately on the commencement of the half-hour period. Some high price events are not forecast prior to the half-hour period and occur once the half-hour has commenced. This may be due to unexpected events such as a power plant failure. The 5-minute increment within the half-hour period when the price first spikes will determine how effective curtailment will be. For example, if the spike occurs in the last 5-10 minutes curtailment will not be effective at significantly reducing prices as the load has been run for most of the half-hour.