

Last month I wrote about what happened with pool prices over 2014-15 in South Australia and Queensland and the opportunity for savings with pool price pass-through strategy and DSM. This week we will have a look at the opportunity in NSW based on 2014-15 historical data.
Table 1 shows that NSW and VIC have been the two regions that have consistently had the benefit of relatively low and stable prices over the last, almost two, decades.
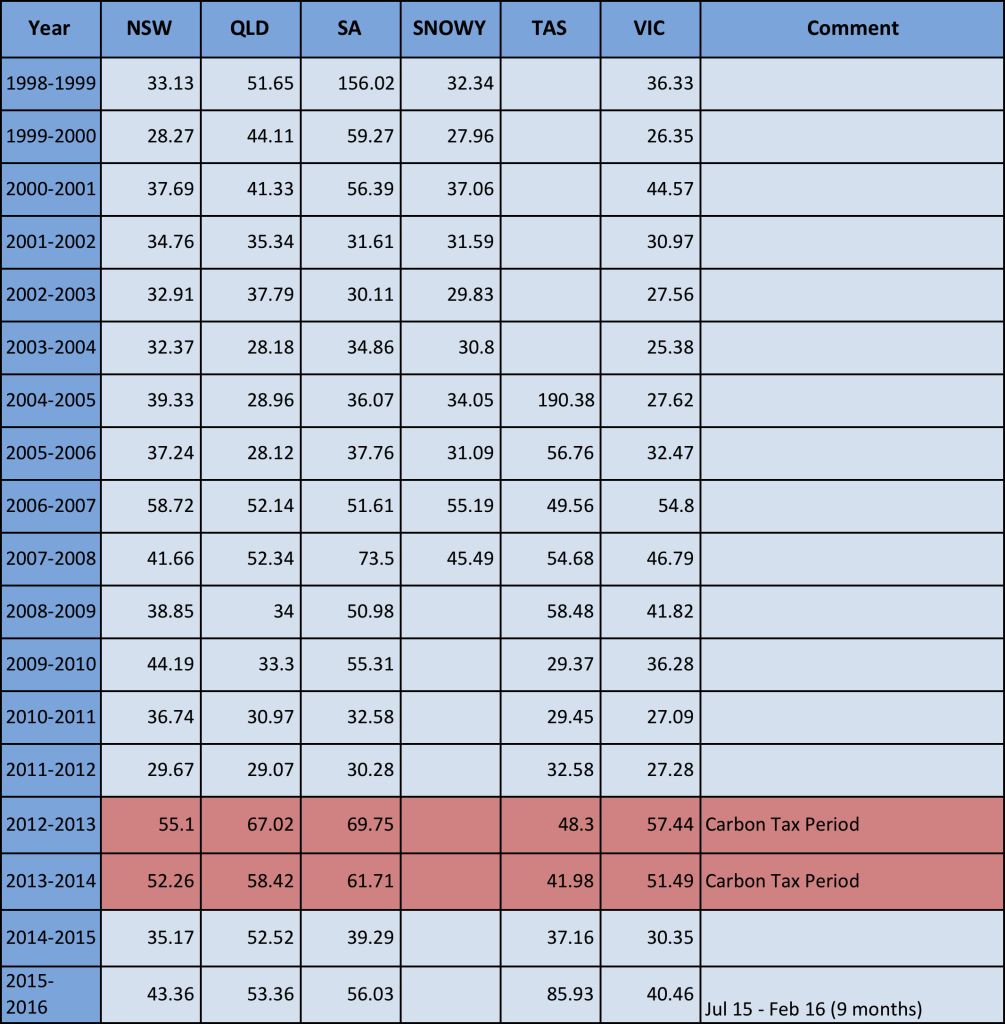
Table 1 – Financial Year Average Annual Spot Prices by Region
Source: http://www.aemo.com.au/Electricity/Data/Price-and-Demand/Average-Price-Tables/Average-Price-Tables-Annual
The relatively lower NSW pricing is explained by the fact that there is a larger market, more generator competition, a large supply of lower short-run marginal cost black coal generation and a less “peaky” market demand than SA all culminating in less price spikes driving the average price up above the median price.

Figure 1 – NSW Half Hour Electricity Spot Prices January 2014 – February 2016
Data Source: NEM-Review
Figure 1 shows that in contrast to SA and QLD there are very few high price spikes. In fact, over the 2014-15 period there were only 5 price spikes above $1,000, three of them lasting only half an hour and 2 lasted 1 hour. There was one price spike above $1,000 in the first two months of 2016.
Once again, a good way to visualise the distribution of prices within each year is to represent them on a box plot. A box plot is a way of displaying the distribution of data based on a five number summary: minimum, first quartile, median, third quartile, and maximum. In the box plot the central rectangle spans the first quartile to the third quartile (the interquartile range or IQR). A horizontal line inside the rectangle shows the median and “whiskers” above and below the box show the locations of the minimum and maximum.
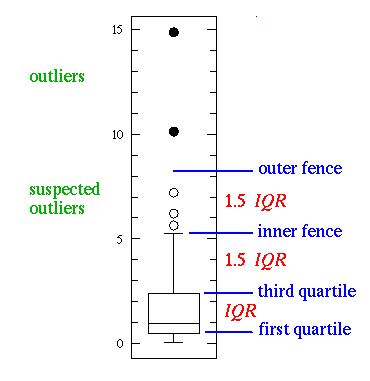
Figure 2 – Diagrammatical Representation of a Box Plot
Source: http://www.physics.csbsju.edu/stats/box2.html
Data will usually display surprisingly high maximums or surprisingly low minimums called outliers. Outliers are defined as either 3×IQR or more above the third quartile or 3×IQR or more below the first quartile. Suspected outliers are slightly more central versions of outliers: either 1.5×IQR or more above the third quartile or 1.5×IQR or more below the first quartile. If either type of outlier is present the whisker on the appropriate side is taken to 1.5×IQR from the quartile rather than the maximum or minimum.
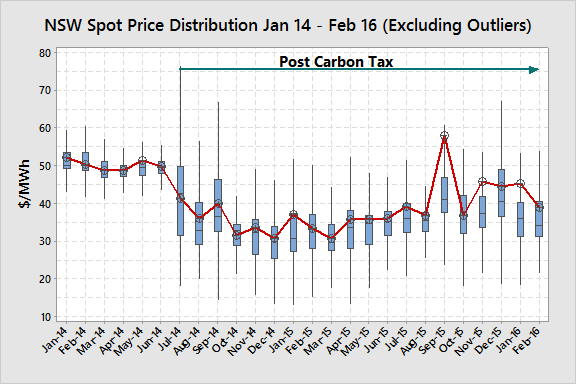
Figure 3 – Monthly Distribution of QLD Half-hour Spot Prices (Data Source: NEM-Review)
Figure 3 shows a Box Plot of the distribution of half-hourly spot prices in NSW from Jan-14 to Feb-16. As the potential range of spot prices spans nearly $15,000 but most price data points are below $60, the outliers are omitted from the graphical display. They are however represented in the average prices shown in red. If outliers are present they will move the average well above the median price and sometimes the whole box range.
The graph shows a few interesting features. The first is the obvious change after the repeal of the carbon tax. As expected, average prices fell but not by as much as they initially went up by (see Table 1). This may have been a hangover of some longer term bilateral contracts or hedges. The second feature is the half-hour volatility increased after the repeal of the tax. The third feature is that from September 2015 the average monthly price has been well above the median in all months except October 2015 meaning that there were more price spikes dragging the average up. One would expect that a customer going to the market in very late 2015 for fixed retail prices for 2016 would have seen higher prices than those that went to the market in early 2015. Timing is very important when going to the market for pricing.
For the purposes of carrying out an assessment of a pool pass-through strategy we will examine the 12-month period from March 2015 to February 2016 as this period is both post carbon tax and contains the more volatile periods commencing in September 2015 and running through into 2016.
Over this period the following price outcomes were experienced:
Peak Average price $53.80/MWh Median price $40.40/MWh
Shoulder Average price $45.29/MWh Median price $37.38/MWh
Off-Peak Average price $33.95/MWh Median price $33.55/MWh
Flat Average price $40.26/MWh Median price $35.90/MWh
A consumer with little ability or desire to curtail load during high price events would need to compare the price offers they receive against these price outcomes. If they are close then there is little incentive to switch to a pool price exposure strategy. If there is a difference that equates to hundreds of thousands of dollars a year when applied to their specific load profile, then they have data to either negotiate a better outcome with their retailer or to support a business case to switch to a pool price exposure strategy. Either way, it is important to analyse what the market is doing before going to the market for pricing.
Would a consumer who has the ability and willingness to curtail load during high price events be much better positioned to adopt a pool price pass-through and DSM approach?
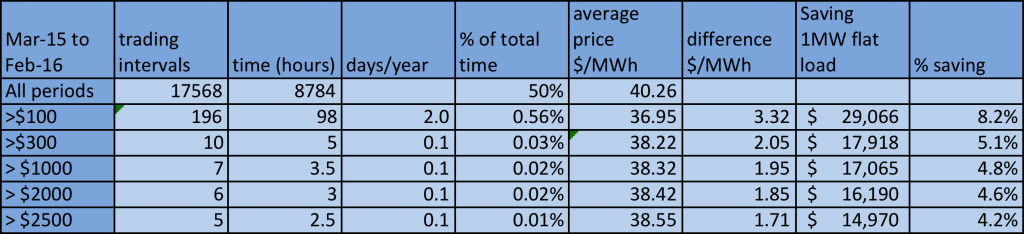
Table 2 – NSW Price Frequency Analysis March 2015 – February 2016 (Data source: NEM-Review)
Table 2 shows the frequency of different threshold price intervals over the period from March 2015 to February 2016. The number of half-hour periods exceeding $100/MWh (10 c/kWh) was 98 for the 12-month period. Had a 1 MW flat load profile business been willing and able to curtail if spot prices exceeded $100 they could have saved up to 8.2%* in cost versus the spot price and achieved an average price of $36.95/MWh (3.7 c/kWh) or a saving of almost $30,000 per year. For a small business this may be a significant saving. In reality a business of this size with the ability to curtail would be very unlikely to have a flat load profile (24-hours a day, 7-days a week). A large number of clients that I work with have a normal operational period of 16 hours per day over day-shift and afternoon-shift on predominantly weekdays. If we apply the same analysis as above but from 8:00am to midnight the results are far different.

Table 3 – NSW Price Frequency Analysis March 2015 – February 2016 (Data source: NEM-Review)
8:00am – Midnight On Weekdays
Table 3 shows that the business that operates at 1 MW load for 16-hours per day on weekdays would obviously be exposed to a higher average price as it operates largely during peak and shoulder periods but the savings of $26,967* with a curtailment strategy would still have been appreciable for that size business.
A much larger business with a 10 MW load would save ten times that amount.
In NSW the opportunities for savings using a pool price pass-through and DSM strategy will depend on the customer’s load profile and the competiveness of the retailer offers.
If your retail price offers sit well above the more recent pool historical pricing or you are interested in investigating how a pool/DSM strategy may reduce costs and wanting to get a better understanding of the opportunities and risks with your particular load profile then contact me at michael@altusenergy.com.au.
Notes:
* This analysis assumes that all high price events were forecast and the user was able to curtail immediately on the commencement of the half-hour period. Some high price events are not forecast prior to the half-hour period and occur once the half-hour has commenced. This may be due to unexpected events such as a power plant failure. The 5-minute increment within the half-hour period when the price first spikes will determine how effective curtailment will be. For example, if the spike occurs in the last 5-10 minutes curtailment will not be effective at significantly reducing prices as the load has been run for most of the half-hour.