

This is the last of an initial series of articles about the opportunities for end users in the mainland regions of the National Electricity Market to save costs by purchasing electricity at pool prices and adopting a Demand Response strategy to save more. The previous articles can be found through the following links for South Australia, Queensland and New South Wales. This week we have a look at the opportunity in Victoria.
Table 1 shows that VIC along with NSW have been the two regions that have consistently had the benefit of relatively low and stable prices over the last, almost two, decades.

Table 1 – Financial Year Average Annual Spot Prices by Region
Victorian spot prices are far less volatile than in South Australia and Queensland as shown below in Figure 1 with very few spikes over the last 26-month period. In fact, over the 2014-15 period there were only 8 price spikes above $1,000, four of them lasting only half an hour, three of them lasted 1 hour and one lasted an hour and a half. Most of these occurred in January 2014. There was one price spike above $1,000 in the first two months of 2016 that lasted for one hour.
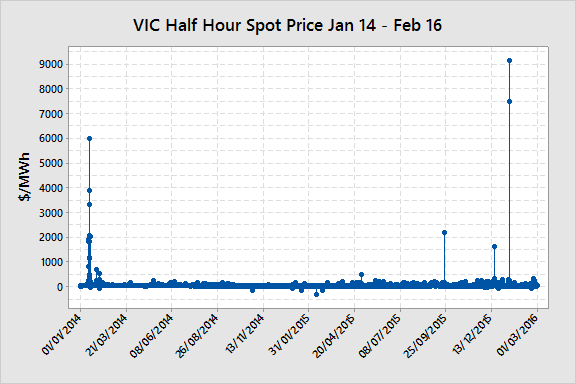
Figure 1 – VIC Half Hour Electricity Spot Prices January 2014 – February 2016 Data Source: NEM-Review
In theory, most of the time the spot price is meant to reflect the short run marginal cost of generation (variable cost) and the price spikes are a feature of the market that both helps to increase the average price towards the long run marginal cost of generation (capital cost recovery + fixed cost recovery + variable cost) and also send an investment signal to the market for new generation. In the case of VIC the market signals (price spikes) are saying no new investment in generation is required.
Having a closer look at the data, Figure 2 shows a Box Plot of the distribution of half-hourly spot prices in VIC from Jan-14 to Feb-16. As the potential range of spot prices spans nearly $10,000 but most price data points are below $60, the outliers are omitted from the graphical display. They are however represented in the average prices shown in red. If outliers are present they will move the average well above the median price and sometimes the whole box range.

Figure 2 – Monthly Distribution of VIC Half-hour Spot Prices (Data Source: NEM-Review)
The graph shows a few interesting features:
- As expected, average prices fell after the repeal of the carbon tax but not by as much as they initially went up by (see Table 1). This may have been a hangover of some longer term bilateral contracts or hedges and this feature has applied across the NEM.
- The half-hour volatility increased after the repeal of the tax.
- Average monthly prices increased in the second half of 2015 but not necessarily due to price spikes. The median prices increased in the second half.
- In December 2015 and January 2016 price spikes did drag the average up above the median.
One would expect that a customer going to the market in very late 2015 for fixed retail prices for 2016 would have seen higher prices than those that went to the market in early 2015. As previously stated, timing is critical when going to the market for pricing.
Over the 12-month period from March 2015 to February 2016 the following price outcomes were experienced (Peak is defined as Mon-Fri 7am – 11pm):
Peak Average price $44.78/MWh Median price $37.99/MWh
Off-Peak Average price $28.42/MWh Median price $27.23/MWh
Flat Average price $36.20/MWh Median price $33.66/MWh
A consumer with little ability or desire to curtail load during high price events would need to compare the price offers they receive from retailers against the above price outcomes. If the prices are close then there is little incentive to switch to a pool price exposure strategy. If there is a difference that equates to tens or hundreds of thousands of dollars a year then a switch to a pool price exposure strategy with or without demand response would be attractive. Either way, it is important to analyse what the market is doing before going to the market for pricing.
How much better off would a consumer with the ability and willingness to curtail load during high price events be than one who could not curtail?
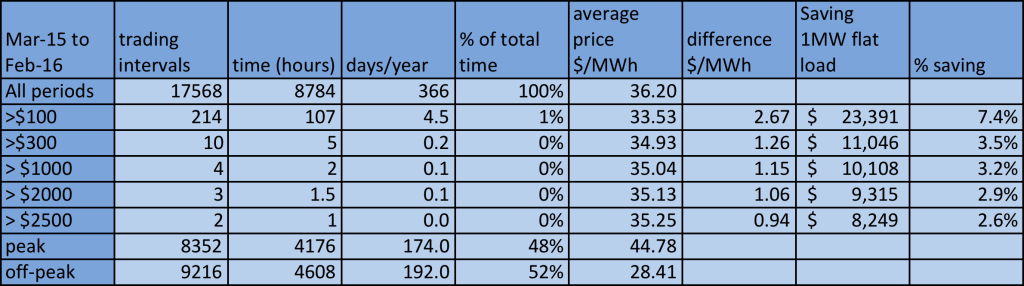
Table 2 – VIC Price Frequency Analysis March 2015 – February 2016 (Data source: NEM-Review)
Table 2 shows the frequency of different threshold price intervals over the period from March 2015 to February 2016 and the corresponding average price that would have been achieved if load were curtailed at that level.
The number of half-hour periods exceeding $100/MWh (10 c/kWh) was 214 for the 12-month period. Had a 1 MW flat load profile business been willing and able to curtail load prices exceeded $100 they could have saved up to 7.4%* in cost versus the spot price and achieved an average price of $33.53/MWh (3.35 c/kWh) for a saving of $23,000 per year.
For a small business this may be a significant saving. In reality a business of this size with the ability to curtail would be very unlikely to have a flat load profile (24-hours a day, 7-days a week). A large number of clients that I work with have a normal operational period of 16 hours per day over day-shift and afternoon-shift on predominantly weekdays. If we apply the same analysis as above but from 7:00am to 11:00pm (16 hours operation during peak periods) the savings are even greater.

Table 3 – VIC Price Frequency Analysis March 2015 – February 2016 (Data source: NEM-Review)
7:00am – 11:00pm On Weekdays
Table 3 shows that the business that operates at 1 MW load for 16-hours per day on weekdays during peak periods would be exposed to a higher average price but the savings of $44,873* (11.4%) with a curtailment strategy would have been significant for that size business. The downside would have been 186 curtailment events equivalent to 93 hours over the year.
A similar sized business that did not have the same ability to curtail load could have chosen $1,000/MWh as the curtailment price threshold. This would have resulted in four half-hour curtailment intervals and a saving of $21,000 (5.4%) versus the spot price.
A much larger business with a 10 MW load would save ten times that amount.
In VIC the opportunities for savings using a pool price pass-through and DSM strategy will depend on the customer’s load profile, the ability to curtail load and the competiveness of the retailer offers.
If your retail price offers sits above the more recent pool historical pricing or you are interested in investigating how a pool/DSM strategy may reduce costs and wanting to get a better understanding of the opportunities and risks with your particular load profile then contact me at michael@altusenergy.com.au or through the Altus Energy website.
Notes:
* This analysis assumes that all high price events were forecast and the user was able to curtail immediately on the commencement of the half-hour period. Some high price events are not forecast prior to the half-hour period and occur once the half-hour has commenced. This may be due to unexpected events such as a power plant failure. The 5-minute increment within the half-hour period when the price first spikes will determine how effective curtailment will be. For example, if the spike occurs in the last 5-10 minutes curtailment will not be effective at significantly reducing prices as the load has been run for most of the half-hour.