
I have written previously about the coming energy cost tsunami in WattClarity http://www.wattclarity.com.au/2014/10/when-the-levee-breaks/ Well, the electricity levee in South Australia has finally broken after severe cracking and the resultant tsunami is now swamping business consumers coming out of contract in 2016. Prices have almost doubled from the already high level they had been previously and customers weren’t expecting it.
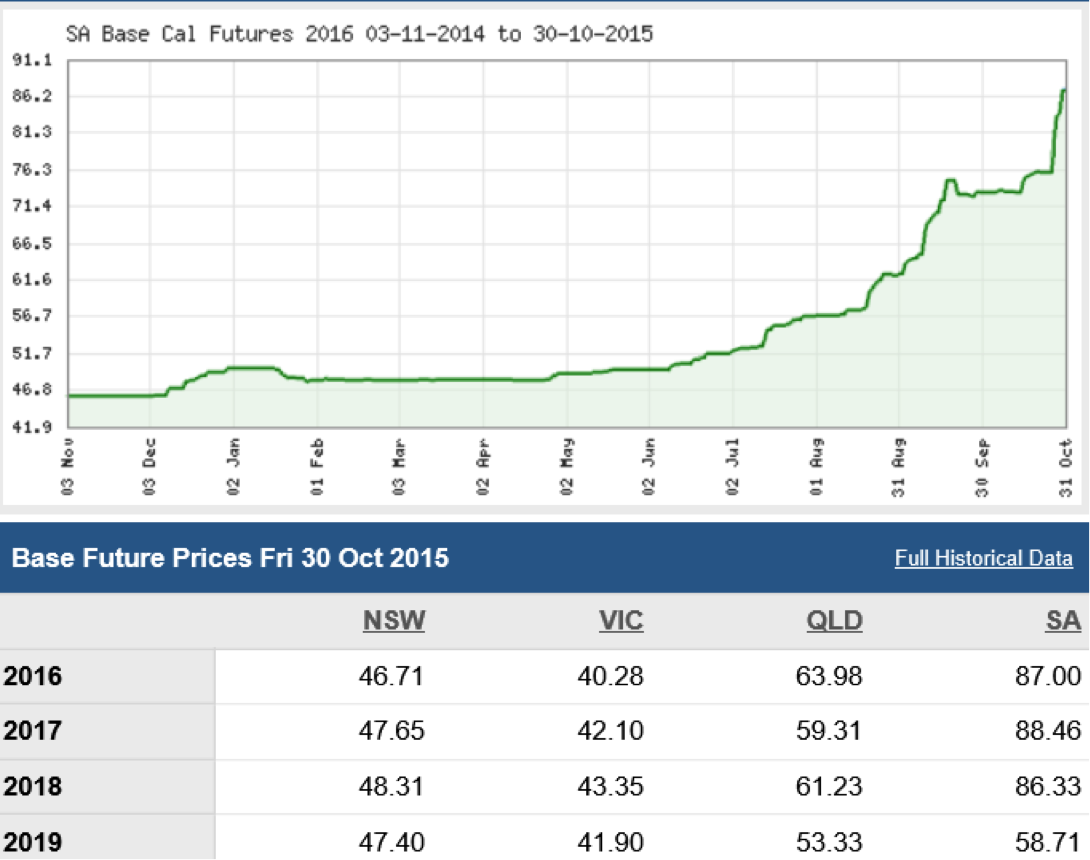
Figure 1 shows the Calendar Year 2016 base futures price history up until 31 October 2015. Businesses that negotiated with retailers and locked in an agreement in the first half of 2015 received pricing not too dissimilar to the previous year. Those businesses in negotiations in the last quarter of 2015 were subject to pricing offers 180% – 200% higher and were forced to make a hard call on what term they locked in. Some customers were able to negotiate terms as short as three months to wait until there was potentially more certainty in the market. Other locked in just one year.
Consequently, many customers were incensed at the increase and asked if there was another way of buying electricity to reduce their costs.
Well, there is. Avoid the worst of the tsunami by jumping in the pool.
What is happening in SA?
On the 11th of June 2015, Alinta Energy announced it would be closing the Port Augusta coal-fired power station at the end of March 2018 and possibly as early as the end of March 2016. This resulted in an increase in electricity futures price for the 2016, 2017 and 2018 calendar years. At the end of July 2015 it announced the closure would be no later than the end of March 2017 and on the 7th October, it announced that the power station would close at the end of March 2016 causing the jump in 2016, 2017 and 2018 futures prices in October 2015.
While the exchange traded SA electricity futures shown in Figure 1 are quite thinly traded; they do give an indication of what is happening with bilateral contracts between market participants. The fact that SA’s only coal-fired base load power generator is closing means that it can no longer offer contracts to other retailers, thus exposing them partially or completely to the spot market price.
The tightening of domestic gas supply is likely to cause an increase in both gas prices and volatility. Also, the high reliance on gas-fired generation, the intermittent nature of wind generation and the concentration of market power to one dominant generator means there is a very high level of uncertainty in SA electricity prices over the next three years and it’s the customer who’ll end up paying for that risk.
A customer buys electricity from a supplier (retailer) who then quantifies the various risks in supplying that customer. That customer can use more, or less power than they have used historically, they can modify their load profiles by using more or less electricity at different times of the day or days of the week or they can go out of business.
The retailer enters into contracts to try and best match their forecasts of their entire portfolio of customers but obviously, it is impossible to match the customer portfolio demand exactly. The retailer needs to quantify the risks and then assign the costs of those risks to the customers.
In simple terms, the price that the customer sees is:
Retail price = contracted energy price + uncontracted price risk premium + volume risk premium + load profile risk premium + retailer margin
The sum of the risk premiums can be significant and in the case of South Australia at the moment they can be enormous.
What Is It Like At the Deep End of the Pool?
Many customers are increasingly pocketing the risk premium themselves by buying electricity at the spot market price (pool price) and managing their own risks by employing Demand Response, a form of Demand Side Management (DSM).
For 15 years, there have been a small but growing number of electricity users purchasing their electricity at the half-hour pool price. Initially, these companies entered into these arrangements with great trepidation due to the perceived high risk of exposure to the maximum price cap at the time of $5,000/MWh (now $13,800/MWh). In time, they found there were very few half hour periods at this level, if at all, and these high price events still did not push the annualised spot price above the fixed price retail offers they were getting.
Most of the half-hour periods of each year approximate the short run marginal cost (variable cost) of generation of the last generator required to be dispatched to meet demand.
If demand is low, then low variable cost coal-fired generation is the dominant form of generation and the spot price reflects that low cost. When demand is high and coal-fired and large efficient gas generation can’t meet demand, then high variable cost generation is dispatched to meet demand (open cycle gas turbine and diesel).
The price spikes add up to increase the average annual price to theoretically reflect the long-run marginal cost of the base-load generator. In simple terms, most of the large generators only just cover their variable costs through most of the year and then rely on the price spikes to eventually recover their capital cost.
This provides an opportunity for the smart electricity consumer. If they purchase electricity at the half hourly pool price and avoid the inevitable low frequency, short duration price spikes through load curtailment (Demand Response), they can achieve very low annual electricity prices.
Figure 2 shows the actual annual time-weighted average spot price for South Australia for 17-years, along with an indicative approximation of fixed price retail offers in the market over the same period. Ignoring the market commencement year before large customer contestability, there has only been one year in 16 where the spot price came anywhere close to fixed retail prices. That year Australia was in the depths of a major drought and any generator (hydro or coal) using fresh water, reduced their output. It was a challenging year for those exposed to the spot price, but only because they had to pay what the vanilla retail offers were asking. In other words, the worst-case outcome is close to the low risk fixed retail price. Armageddon isn’t as bad as it is made out to be. The graph also puts the current 2016 retail prices in an historical context. Price offers are significantly above anything that has been over that 16-year period.
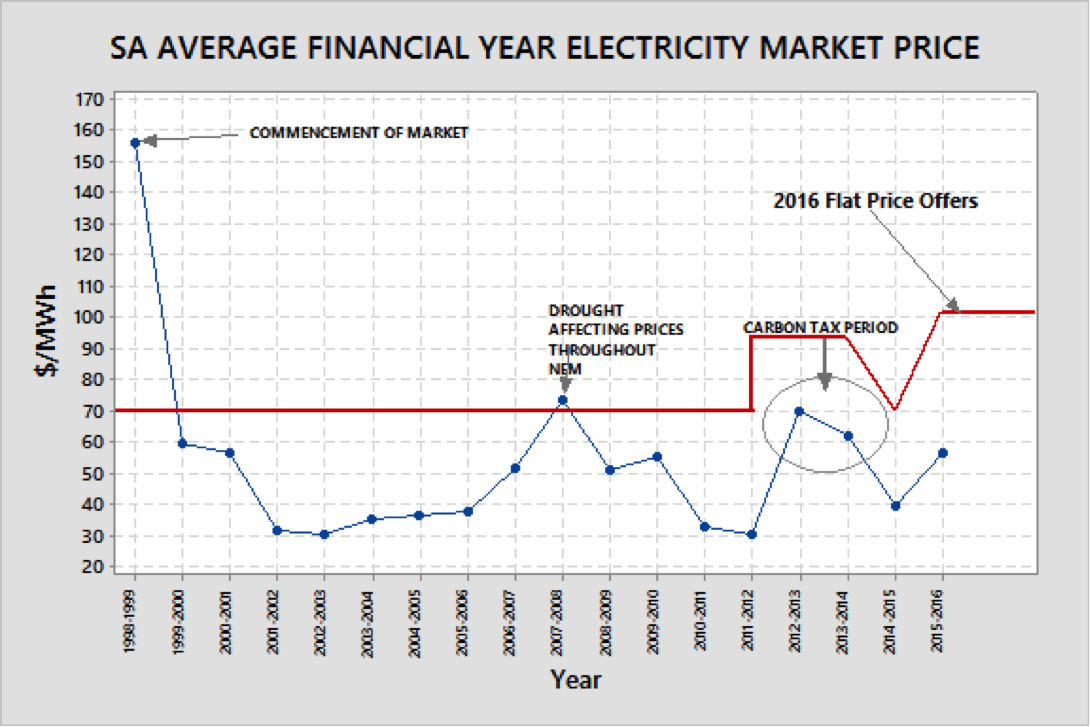
Figure 2: Historical average annual spot prices (data source AEMO) and general level of retail offers
Those consumers that had the ability to shed load during high price events were far less exposed to the time weighted annual high price. Most customers who employ Demand Response are able to achieve pricing outcomes 5-10% lower than the annual spot average by curtailing load during high price events.
Setting Up A Pool Price Pass-through and DSM Strategy
Before embarking on a pool price pass-through arrangement, it is important to understand how the market operates, the opportunities, the risks and the operational constraints. It is also critical to educate any staff and employees that are involved.
All businesses are different. Some operate 24/7 and any minor disruption has a high opportunity cost. Some businesses operate all of their equipment well under capacity and are not sensitive at all to short stops. Most are in between.
It is important to do a study on all of your major equipment. You will need to determine which equipment are bottlenecks (constraints), which are utilised below full capacity, the implications of shutting down a constrained asset for a short period, and the consequential break-even cost of shutting down. Some equipment cannot be shutdown at all; other equipment can only be shut down if stocks allow.
From this analysis, a load-shedding schedule can be constructed with a list of equipment to be shut down at different price thresholds. Some of these may have discretionary actions dependent on product stock levels or actions requiring escalation for approval before shutting down. Some businesses may choose to shut all equipment down at one price level, some will have different levels for different assets and some may choose not to shut down at all. If a business elects not to shut down at all, it will still likely see a 12-month average price at far less than their best retail offer.
When constructing the load-shedding schedule, it is necessary to have an understanding of the likely number of curtailment events and the duration of those events. Figure 3 shows a probability distribution curve for the half-hour SA spot prices over the two calendar years 2014-15. It shows that 99.5% of all prices were below $299/MWh and 95% of prices were below $74/MWh.
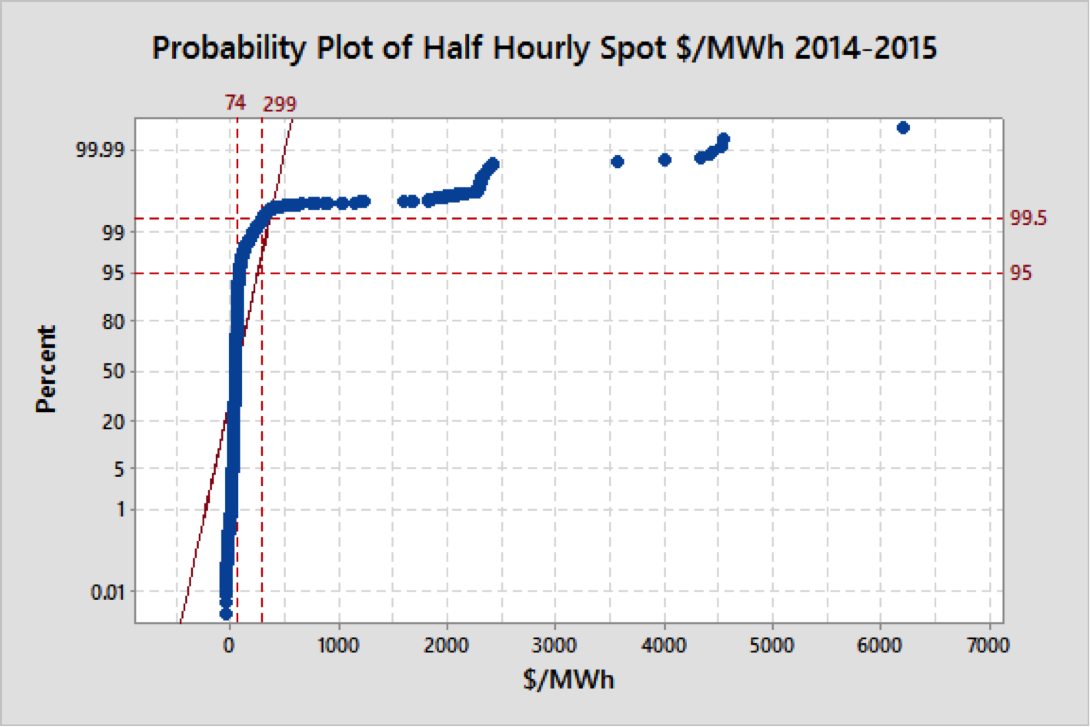
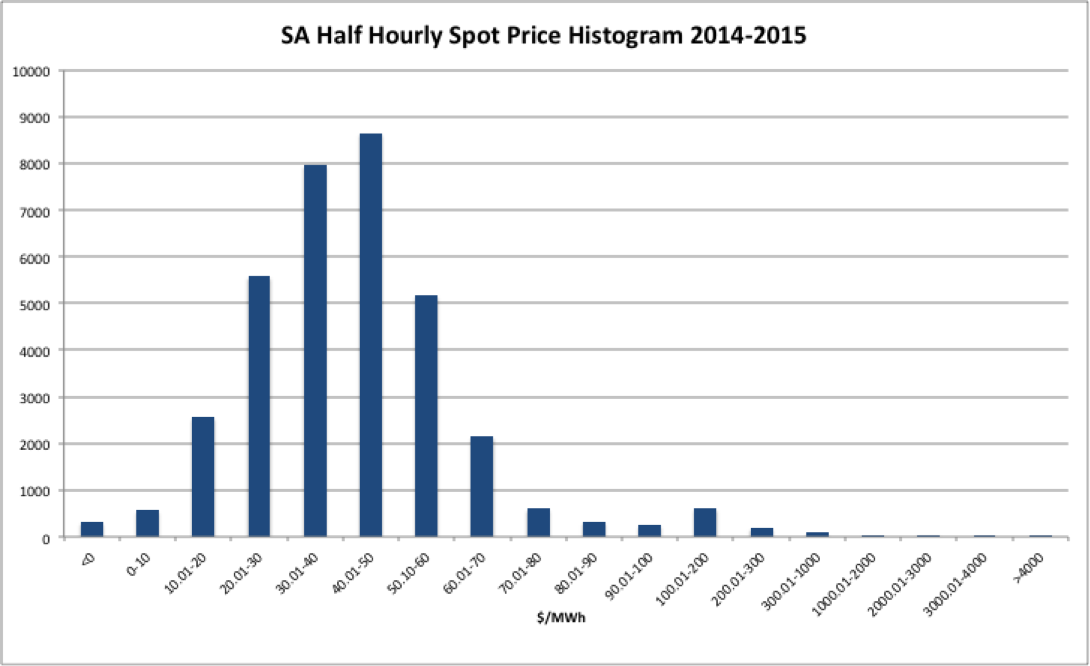
Figure 4: 2014-15 SA Half-hour Spot Price Histogram
So let’s have a look at what would have happened over 2014 and 2015 had a business been a 1MW flat load running 24/7 and exposed to the pool using DSM to manage risk. We’ll assume perfect price forecast information and perfect load shedding execution.
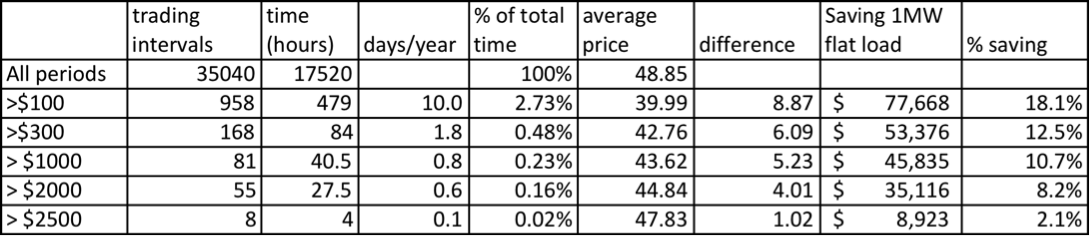
Figure 5: Theoretical Savings at Different Price Thresholds for a 1 MW Flat Load
If the business did not curtail any load and were exposed to the spot price over the whole 2-year period, then the average price would have been $48.85/MWh (or 4.885 c/kWh). This average price for all periods is fairly close to what a lot of customers paid for off-peak over this same period.
If the business had a plant that was not fully utilised and had a reasonable amount of downtime through the year, then they may have chosen to shed load if price exceeded $100/MWh. This would have required the equivalent of 10 full 24-hour days off and theoretically reduced the spot price by 18.1% giving a theoretical saving of almost $78,000 over the spot price.
If $1,000/MWh was chosen as the price threshold for all equipment in the 1 MW flat load plant, with perfect forecast information and perfect load curtailment, the saving that could have been achieved versus the spot price was nearly $46,000 per year and “only” required annual downtime of 40 hours. This was still a saving of 10.7% versus the spot price.
The level of operational interruption if load shedding occurred at $1,000/MWh is shown in Figure 6. Over a two-year period, 71 of the 81 high price events were only of a half hour duration. Only nine events went as long as 1-hour and one event of 1.5 hours. The impact of curtailment is often minimal when compared with other causes of plant stoppages.
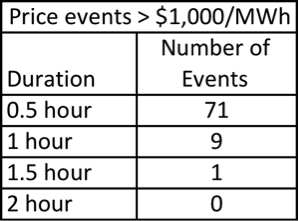
Figure 6: Duration of High Price Events in SA > $1,000/MWh 2014-2015
These savings are theoretical though and assume perfect forecasting of all events and immediate load shedding. The final settled half-hour price is the average of six 5-minute dispatch interval prices. This means that if a price spike occurs in the last 5-minute interval of the half-hour, then the settled price for the full half-hour will be impacted by that last price.
Even if the business sheds load immediately at the start of the last interval, the hour half price will increase and the average load over the half hour would still be high. In reality, forecasts can’t predict sudden generator or inter-connector failures that cause price spikes and load shedding is not perfect. The table does, however, give an indication of the size of the prize if load shedding is employed along with spot price exposure.
In a real example of a company that I used to work for, the annual consumption was around 180 GWhs per year. The savings in taking a pool price pass-through arrangement enabled us to save around $3.8m per year versus the best fixed-price retail offer with an additional $1.5m savings per year by employing Demand Response. This gave us total annual savings of $5.3m (equivalent to 2.9 c/kWh). In this case, there were several price thresholds for different assets and some large equipment was not shut down at all.
Real time, accurate market information is crucial to a Demand Response strategy. NEM-WATCH is a great tool enabling the operations staff to monitor the market, prepare for high price events and get alerts in the event of sudden high price events. It provides an overview of what is happening across the entire network and a more detailed picture of what is going on in the hub where the business operates with regard to forecast and actual demand, price and generation mix including wind and solar PV.
Pool Price Expectations for 2016 – 2017
With the impending closure of the Port Augusta Power Station, it is expected that spot prices will increase. Certainly it can be expected that there will be an increase in the number of price spikes and also the median price would increase. The average annual price would be expected to increase. However, retailers have already factored this into their risk premium and assumed worst-case scenarios. The 100% price increases offered are likely to be highly conservative, from their point of view.
Figure 7 shows the impact on electricity savings with increases in the annualised spot price. Even with a 100% increase, there are still modest savings before employing Demand Response. Demand Response would increase those savings.

Figure 7: Impact of SA Spot Market Price Increases
Load Planning
DSM not only involves a strategy to react to high price events (Demand Response), but also includes planning ahead to shift load to periods that are expected to have lower prices, and avoiding maximum load during periods that are expected to have high prices. This can include organising scheduled shutdowns in periods that have a higher likelihood of high prices. Figure 8 shows that high price events occurred largely in the months of January and July during the 2014-2015 period, great months to schedule major shutdowns. Figure 9 shows how these high price spikes then impacted the average monthly price.
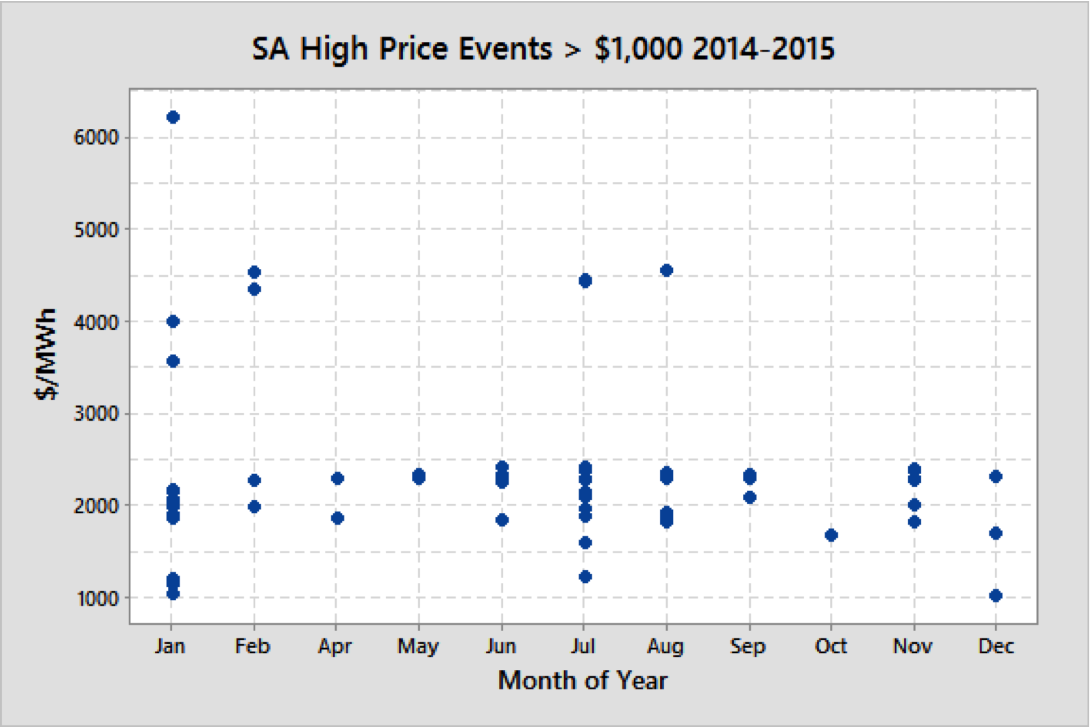
Figure 8: High Price events in SA > $1,000/MWh By Month of Year 2014-2015
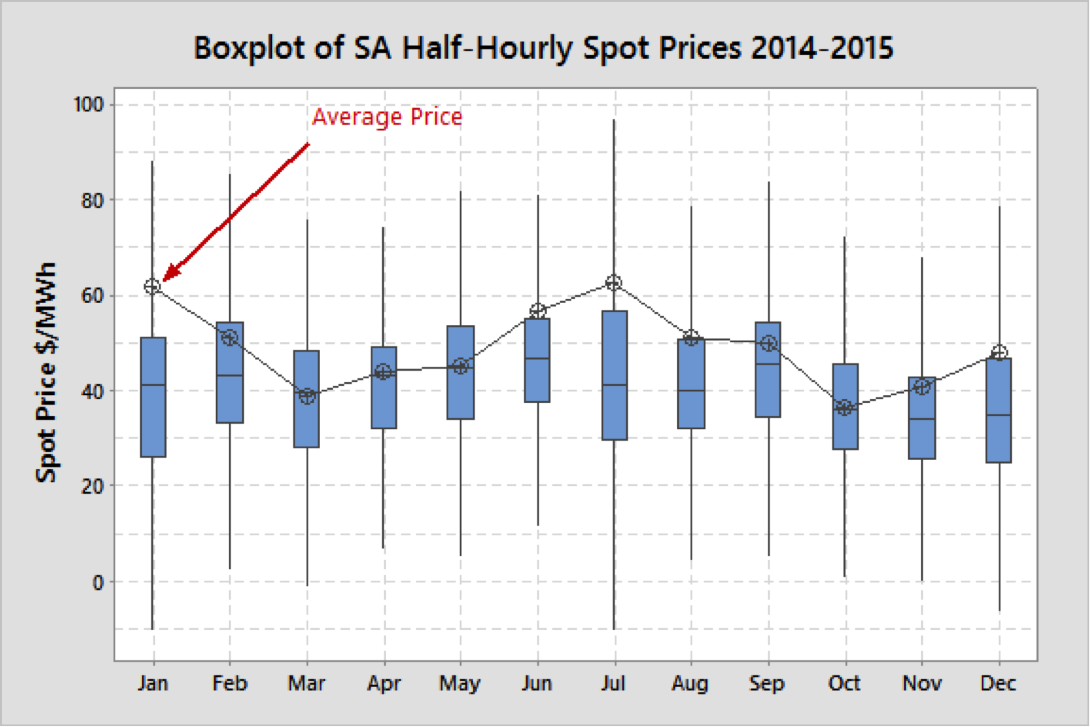
Figure 9: Average Monthly SA Spot Prices 2014-2015 (excluding outliers)
Figure 10 shows typical price distributions over the 2014-2015 period (excluding outliers). By maximising load during the night and minimising load during the day (particularly late afternoon and early evening), the average price can be reduced. Scheduling short maintenance outages on major equipment in the afternoons rather than back shifts can help achieve that outcome.
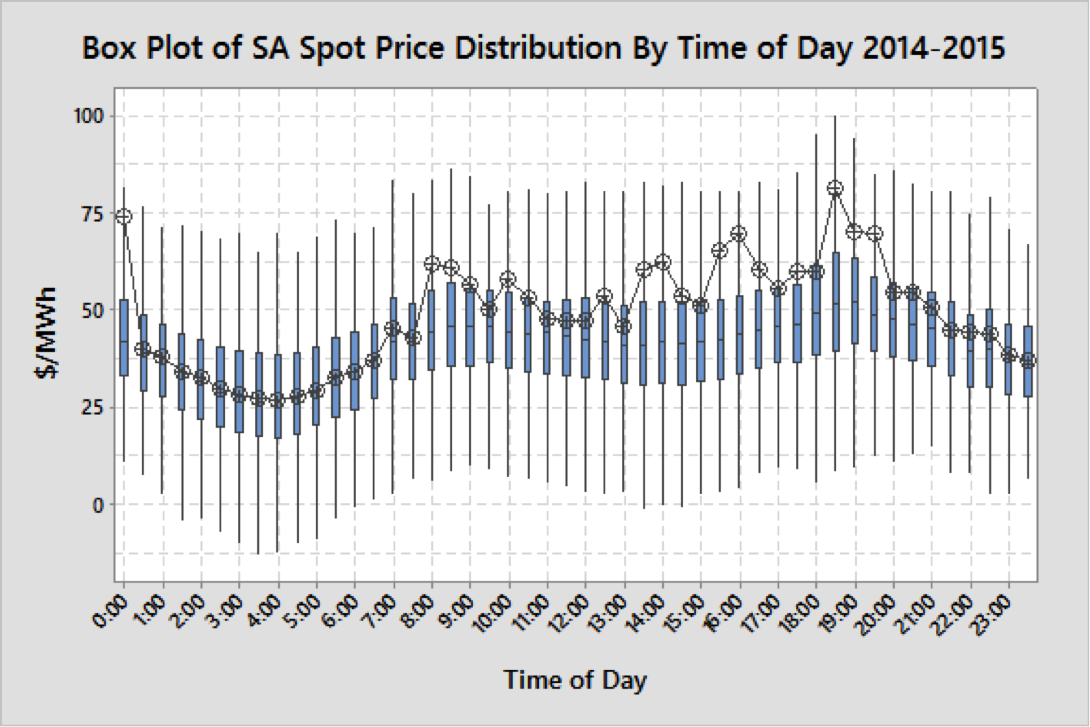
Figure 10: SA Half-hourly Spot Price Distribution By Time-of-Day (Excluding outliers)
Call To Action
Pool exposure and DSM is not for all businesses. Some businesses require absolute certainty in their cost inputs even if they are sure to be at a higher price. For some, the savings may be too small to spend time and resources in setting it up. Others may not be able to tolerate the risk or potential fluctuations in monthly bills.
For those businesses with significant electricity spend and are in the relentless pursuit of finding cost savings, a pool pass-through arrangement coupled with a DSM strategy may deliver significant savings.
If you are interested in employing a pool/DSM strategy to reduce costs and wanting to get a better understanding of the risks and potential rewards then contact me at michael@altusenergy.com.au