
1 January 2016 was the start date for the new “high price” contracts for SA business consumers that renewed their retail supply contracts in the second half of 2015. Quite a few consumers decided not to lock in the high fixed retail pricing but instead adopt a pool price pass-through arrangement with an accommodating retailer.
So how would have those consumers fared over the first two months of the year?
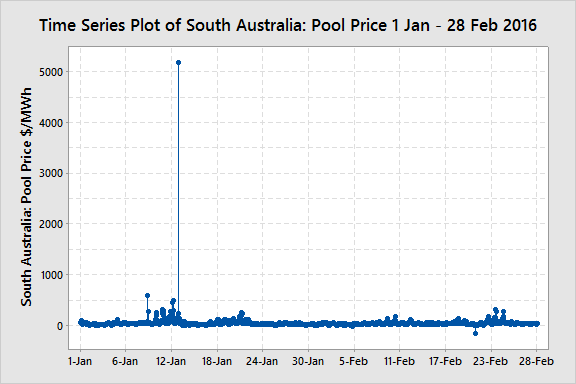
Figure 1 – Time Series Plot of SA Half-hourly pricing 1 Jan – 28 Feb 2016 (Data source: NEM-Review)
Figure 1 shows a time series plot for every half hour interval for the first two months of the year (excluding 29th February – the day of writing this article). It can clearly be seen that there was one “scary” spike above $5,000/MWh in mid January and several smaller spikes around the several hundred dollars per MWh at that time. The popular misconception about being exposed to the pool price was that that one half hour interval would have been disastrous had the consumer not be able to shed load during that period or if they didn’t have a price cap (financial instrument) in place. It is not disastrous at all as can be seen in Figure 2. Most of the time the half hour pricing is well below the fixed retail pricing and so the average is well below the fixed retail pricing.
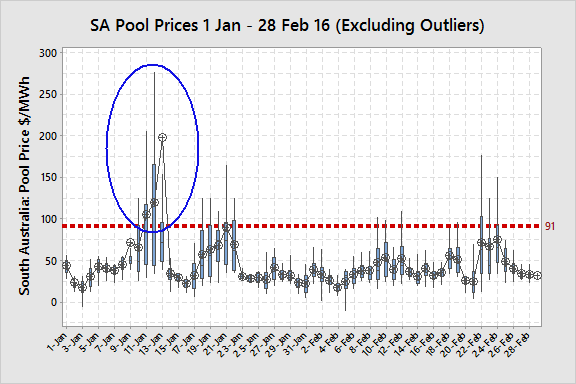
Figure 2 – Box Plot of Half-Hour Prices in SA Jan – Feb 16 Excluding Outliers
Figure 2 shows that just 3 days in the two months had an average daily price (indicated by the connected symbols) above the typical fixed flat retail price of approximately $91/MWh (derived from recent price offers of Peak 11c/kWh and Off-peak 8 c/kWh). On a very high proportion of the days the average price was at or below 50% of the fixed retail price. This resulted in the following pricing results:
- Over the first two months of 2016 the average SA spot price was $45.55/MWh (or 4.6 c/kWh)
- The average spot price during peak periods was $64.95/MWh (or 6.5 c/kWh).
- The average spot price during off peak periods was $33.84/MWh (or 3.4 c/kWh).
The savings over this period for a flat 1 MW load with a load factor of 100% would have been $64,772 versus the typical fixed retail contract. This would have been the savings had the consumer continued to run through all the high price events including the $5,000/MWh event and not shed load.
If that same hypothetical load (1 MW and 100% load factor) had been able to curtail its load during high price events then the savings would have been even higher as shown in Table 1.
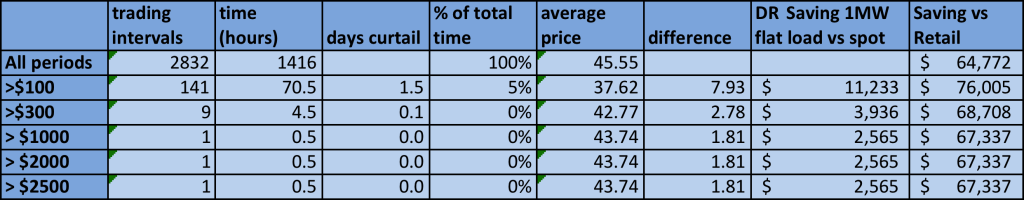
Table 1 – Savings For Pool Pass-through and DR Strategy in SA Jan – Feb 16 (1 MW Flat Load)
Table 1 shows that the major savings came from a straight pool pass-through without DR and that DSM only provided modest additional savings. However, in this case there was only one price spike above $1,000. Had there been a greater number of very high price spikes obviously the savings without DR would have reduced and the savings with DR increased.
The 2016-2018 retail pricing is based around the Northern Power Station closing down shortly (scheduled for end of March, but there has been some talk of a bit later). The impact of this closure would therefore not be seen until the second quarter and probably not until the colder months of June and July.
There is much concern about what will happen to average spot prices once the Northern Power Station closes down (see also here for concerns during 2015, with Northern operating). The 2016 pricing would have been based on 2nd, 3rd and 4th quarter pricing being significantly higher than the 1st quarter. So it would be expected in our previous analysis that January and February average spot pricing was well below the typical 2016 retail offers.
So how can we construct a forecast for pricing once NPS closes? The answer is “with great difficulty”. The market is a competitive market and different generators either compete with each other to ensure that they are dispatched to meet their contracts and to minimise ramping load up and down or they offer uncontracted generation at high prices to make opportunistic profits. NPS is a coal fired power station and designed for operations at steady load. They bid low prices to ensure they are dispatched to meet their contractual requirements. When they exit the market the only other base-load generator left will be Torrens B which is a gas fired reheat boiler generator. Boilers are also typically designed for steady operation and so, to the extent that it is contracted, it will likely bid in low prices to ensure the contracted generation is dispatched without having to cycle up and down. The Torrens B plant has four boilers and so it will likely run the required number of boilers to meet its contracted demand and price the uncontracted capacity at very high prices, as it does currently.
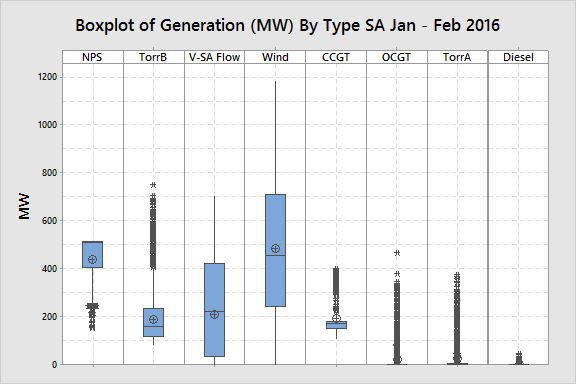
Figure 3 – SA Half-hour Generation Load (MW) By Type Jan – Feb 2016
Figure 3 shows that NPS output was typically 400-500 MW over January and February. After March this generation will disappear from the generation mix and the gap will need to be filled by Torrens B (Gas Reheat Boiler), interconnector flows from Victoria, Combined Cycle Gas Turbine (CCGT) and “top ups” from Open Cycle Gas Turbine (OCGT), particularly when the wind isn’t blowing. AGL have announced the mothballing of Torrens A, which has really been acting as a peaking plant.
There will be two major impacts from this change:
- Torrens B will have a significant increase in market power being the only base load generation left. They are likely to increase the median half hour spot price by setting higher bid prices for offered generation and possibly withhold some available capacity (bid at very high prices) to facilitate price spikes.
- During periods of high demand and/or low wind the peaking OCGT and diesel will be required to meet demand resulting in an increase in the number of very high price spikes and an increase in the average price.
Without doubt, prices are going to increase and the retail offers reflect that reality. The question is by how much?
I have attempted, without success, to build regression models for pricing based on the generation mix, demand and wind. I therefore analysed the SA data over 5-years using data from NEM-Review to compare pricing when NPS was running and when it was not. The results were:
| NPS Running | NPS Not Running |
| N = 76,911 | N = 10,737 |
| Average Price = $47.20/MWh | Average Price = $71.54/MWh |
Table 2 – Impact on SA Spot Pricing With and Without Northern Power Station Operating 2011-15
The data is made more complex by the fact that there was a carbon tax in place between Jul 2012 and June 2014. The carbon tax increased average spot prices by $25.80/MWh when comparing the same set of data with and without the carbon tax.
The difference in pricing without NPS running was an increase of $24.34/MWh (about the same as the carbon tax) or a 52% increase. The retailers have factored in an almost 100% increase. Using this method we could estimate a future expected spot price annual average:
- 2015 Average $49.58 + $24.34 = $73.92/MWh
- 2015 Average $49.58 x 1.52 = $75.36/MWh
I also applied another method where I built a matrix of SA 2015 actual data with low, medium and high wind generation and low, medium, high and very high demand and determined the average price for each quadrant and the number of half hour intervals that fell in this quadrant. I then “shifted” demand by adding the actual output of NPS to each historical half hour demand and rebuilt the same matrix for the higher demand level and calculated a new weighted average price. Using this method the new forecast price with a shift in demand to the right was $75.68/MWh.
So my “peg-in-the-ground” forecast for annual average prices post NPS closure is around $75/MWh. I would encourage others to attempt to forecast their expectations for pricing to open up a discussion.
If SA annual spot pricing does settle around the $75/MWh mark, the savings for the hypothetical 1 MW flat load versus the current retail pricing would be of the order of (91-75) x 24 x 365 = $140,000 per year without any curtailment. I would rather those funds going to the business bottom line rather than the retailer.
If you would like to find out more about development and implementation of a pool pass-through strategy with and without DSM contact me at Michael@altusenergy.com.au