Pool prices fell last week due to strong wind generation throughout most of the week and some negative half-hour prices dragging the average down below the median price.
The average price was a relatively low $61.09/MWh with the median price being $65.13/MWh. The average was lower than the median due to several half-hour periods of negative prices, the lowest of which was -$366.10/MWh. There were no half-hour prices above $300/MWh and only eight half-hour periods above $200/MWh. The negative prices were the result of high wind and rooftop solar generation and low demand.
Figure 1 shows the daily half-hour box plot inclusive of outliers for the week and Figure 2 shows the same box plot with the outliers removed. The average price on Sunday 29th was $5.25/MWh.
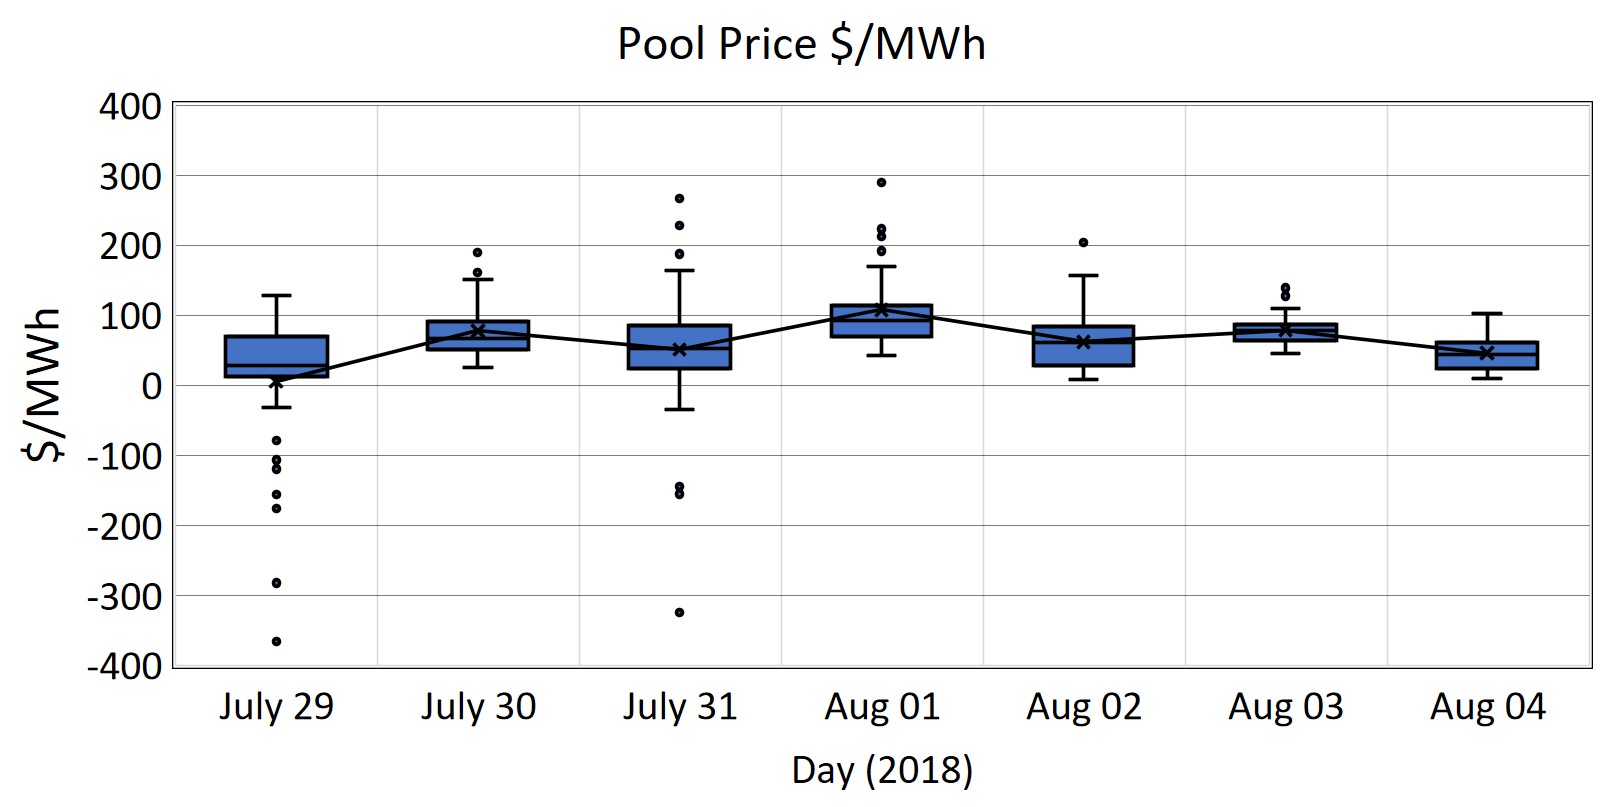 Figure 1. Daily SA Pool price box plot with outlier (Data Source: NEMReview)
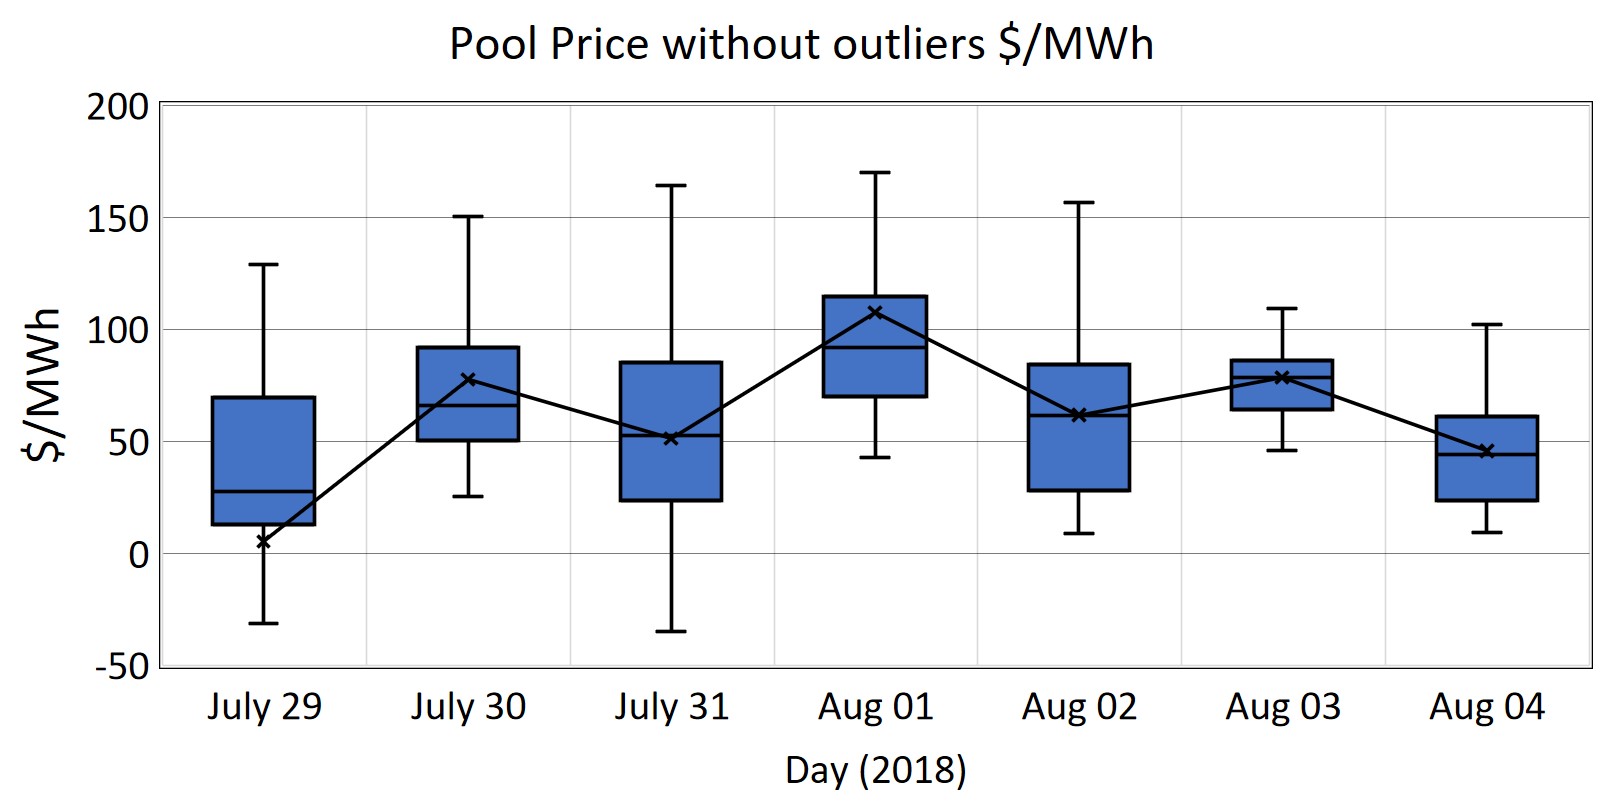 Figure 2. Daily SA Pool price box plot without outlier (Data Source: NEMReview)
The SA demand time series (Figure 3) shows a somewhat typical winter demand pattern with two clear peaks per day: one peak in the morning when people wake up and the second when they arrive home after work in the early evening. There is also a short smaller spike at midnight when many hot water services kick in. During this week though there was an unusual drop in the peak, median and average demand on Thursday 2nd August by more than 200 MW. This was likely due to a major industrial outage on that day.
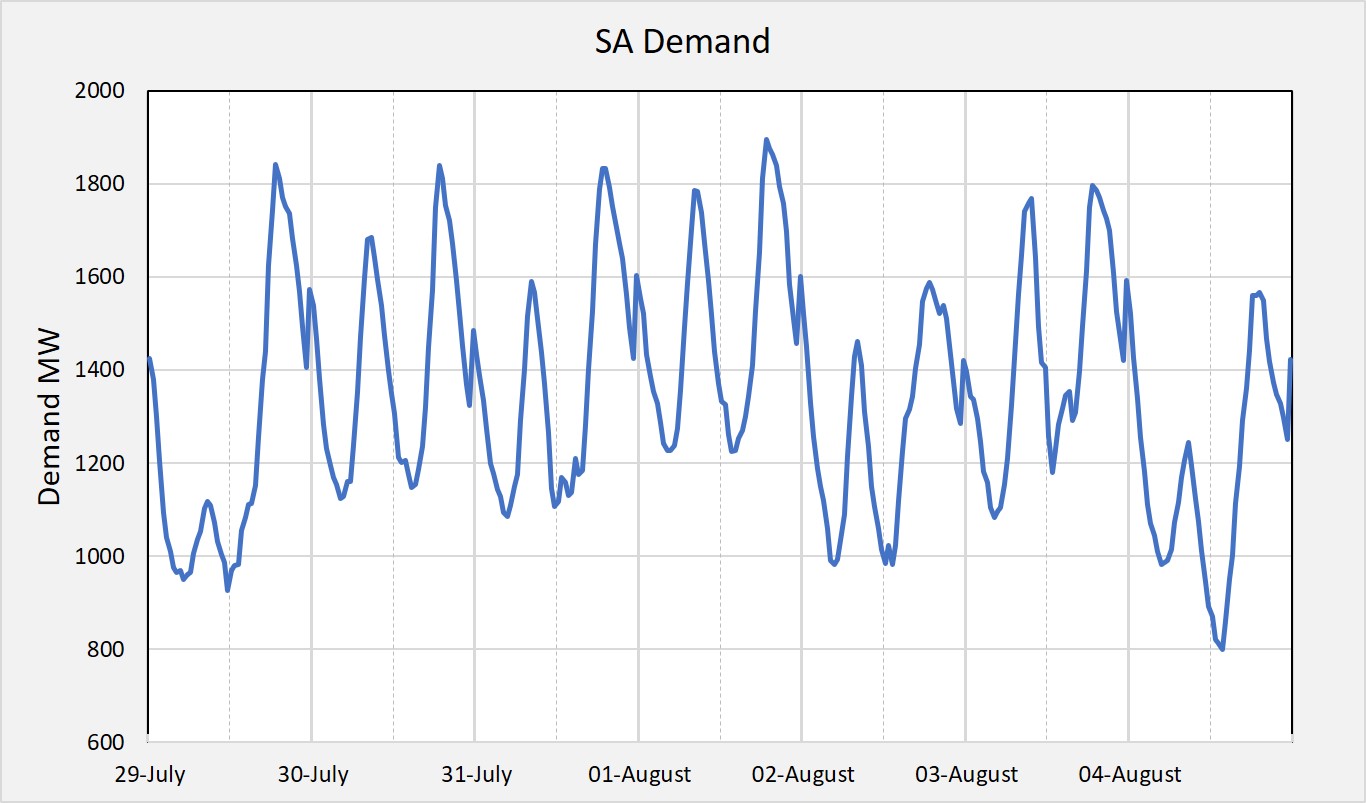 Figure 3. SA Electricity Demand Time Series (Data Source: NEMReview)
As would be expected, Figure 4 shows that pool prices follow a similar pattern to demand with higher prices in the early morning and early evening and lower prices overnight during low demand and during the day during modest demand and high solar generation. Most of the negative prices occurred during the middle of the day when there was high solar generation on top of strong wind generation.
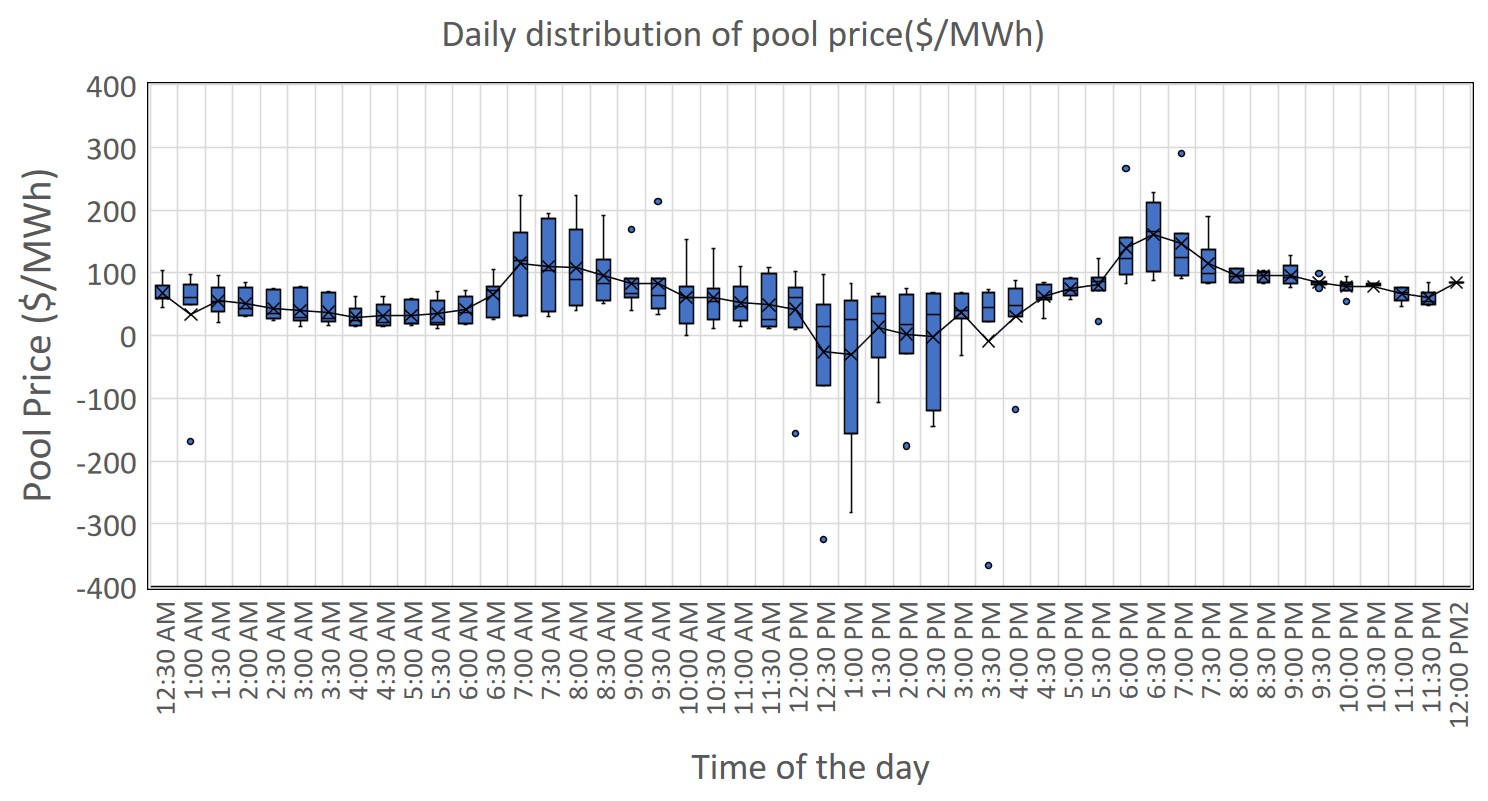 Figure 4. South Australian Daily Pool price box plot (Data Source: NEMReview)
The generation mix for the week shown in Figure 5 clearly shows strong wind generation (orange) from July 29th to July 31st, and from the last hours of August 1st until August 3rd. The wind generation was very low through most of the 1st August. The chart also shows that Osborne (blue) ceased generation after the 1st August.
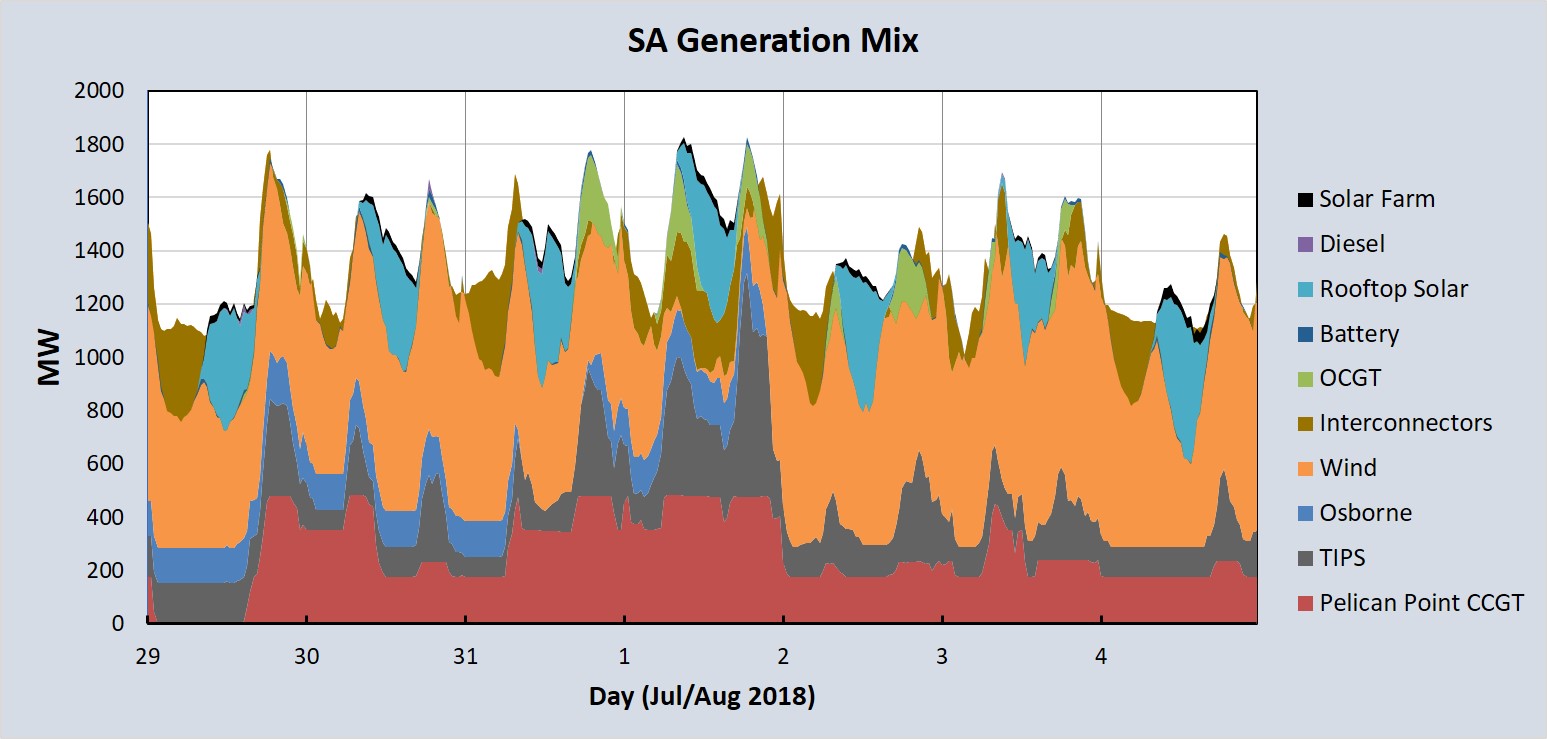 Figure 5. South Australian Generation Mix (Data Source: NEMReview)
Looking more closely at the individual forms of generation, Figure 6 shows how pronounced the one day drop in wind generation was. From the 2nd August, the wind generation was both high and very consistent.
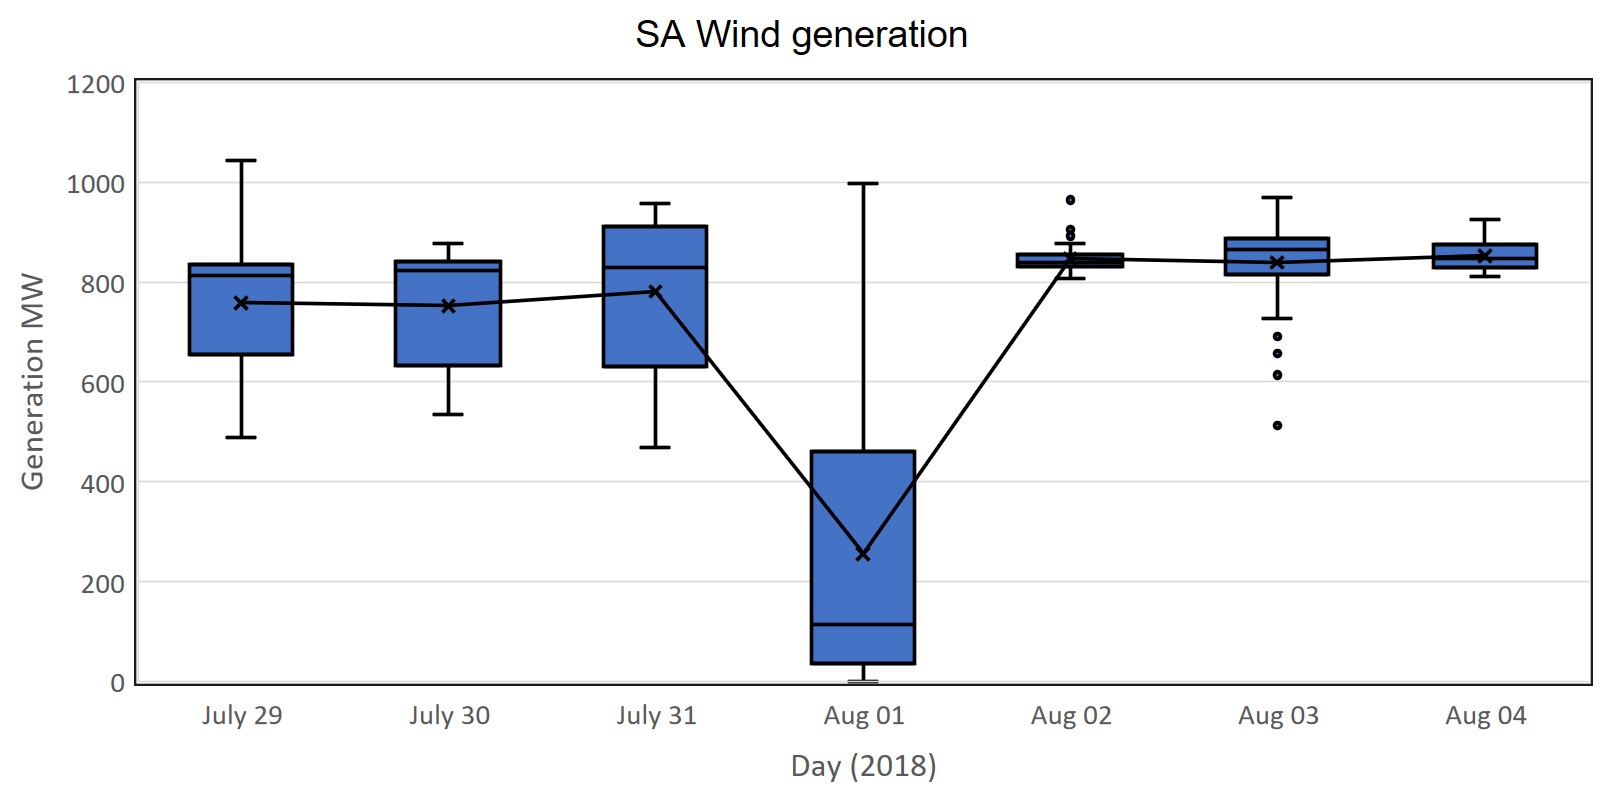 Figure 6. Daily SA wind generation price box plot (Data Source: NEMReview)
Pelican Point (Figure 7) ramped up to full capacity in the first half of the week (after being off in the first hours of the 29th July) and then ramped down on 2nd August with the drop off in demand and increase in wind generation.
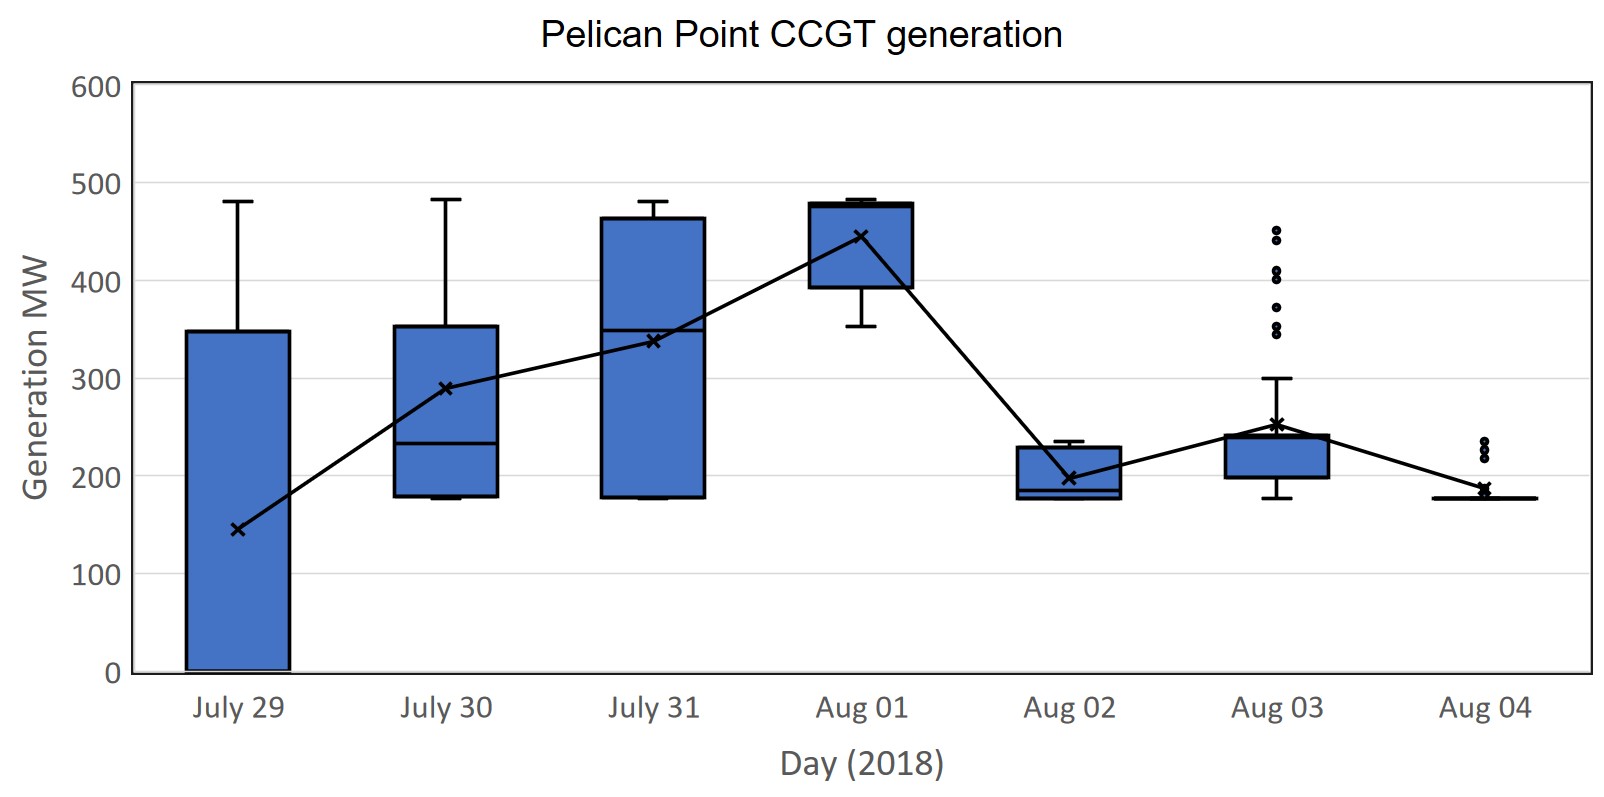 Figure 7 Pelican Point Power Station Daily Generation Box Plot (Data Source: NEMReview)
The Osborne Power Station (Figure 8) which was turned back on on the July 24th (as shown in the previous post), was turned off again on the August 2nd either due to being outbid to supply the gap between demand and renewable generation or due to maintenance. It was also off for about 9-hours on the 31st during the daytime period of low and negative prices. It was likely outbid by Pelican Point which was running at a relatively high output during that same period.
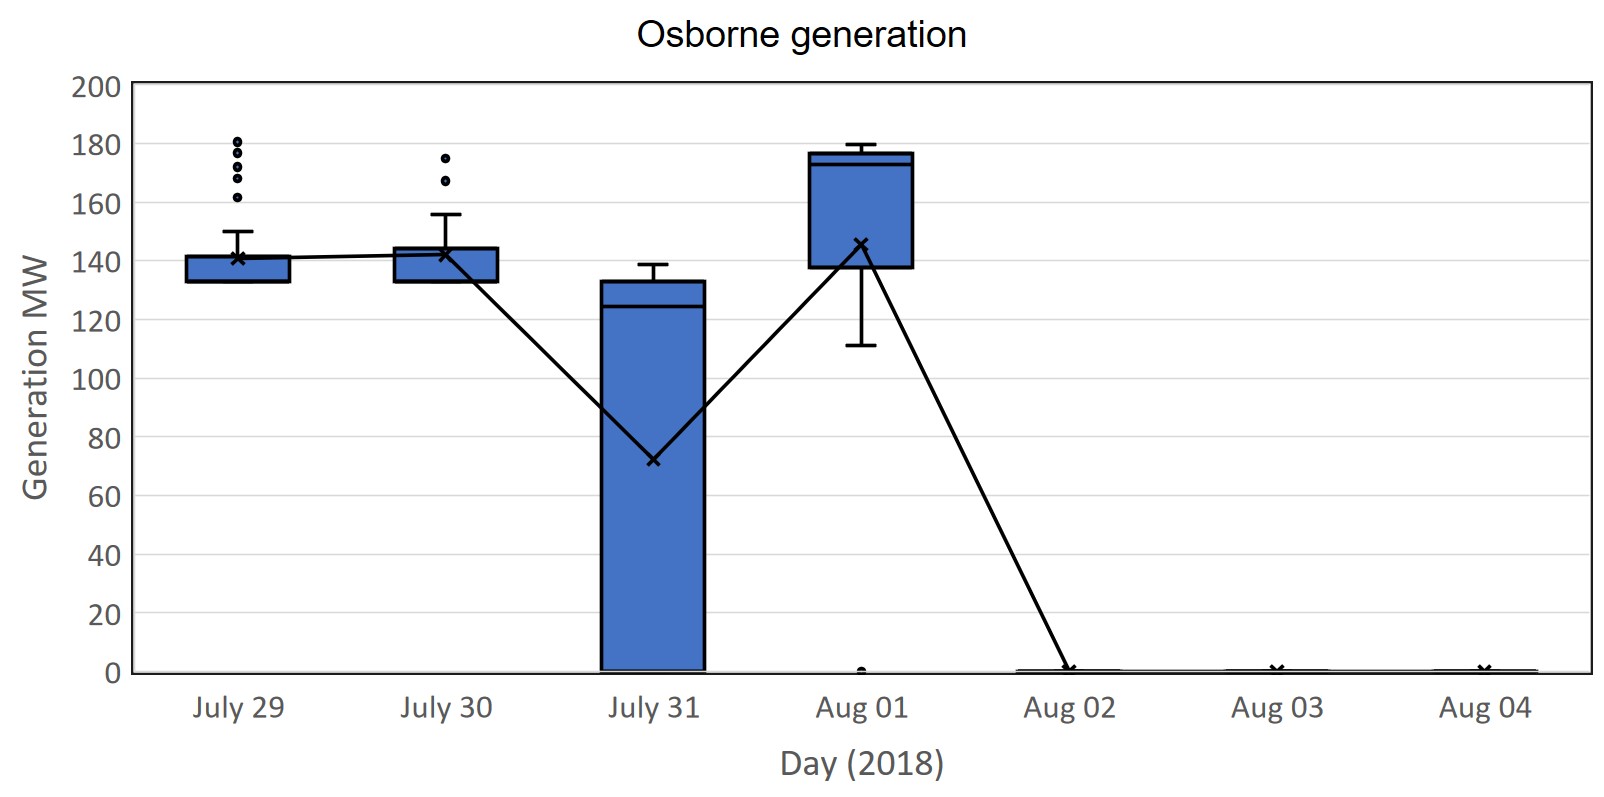 Figure 8 Osborne Power Station Daily Generation Box Plot (Data Source: NEMReview)
The Torrens Island Power Station (TIPS A&B) continues to have a large variation in daily half-hour generation as it tends to have a bidding strategy that prices a larger portion of its generation capacity at prices above Osborne and Pelican Point generation prices. This means that it ramps up and down to meet the cyclical demand that is not met by Osborne, Pelican Point and wind generation. Figure 9 shows that during this last week, TIPS ran at a low output on most of the days, except on August 1st when the Wind generation decreased sharply.
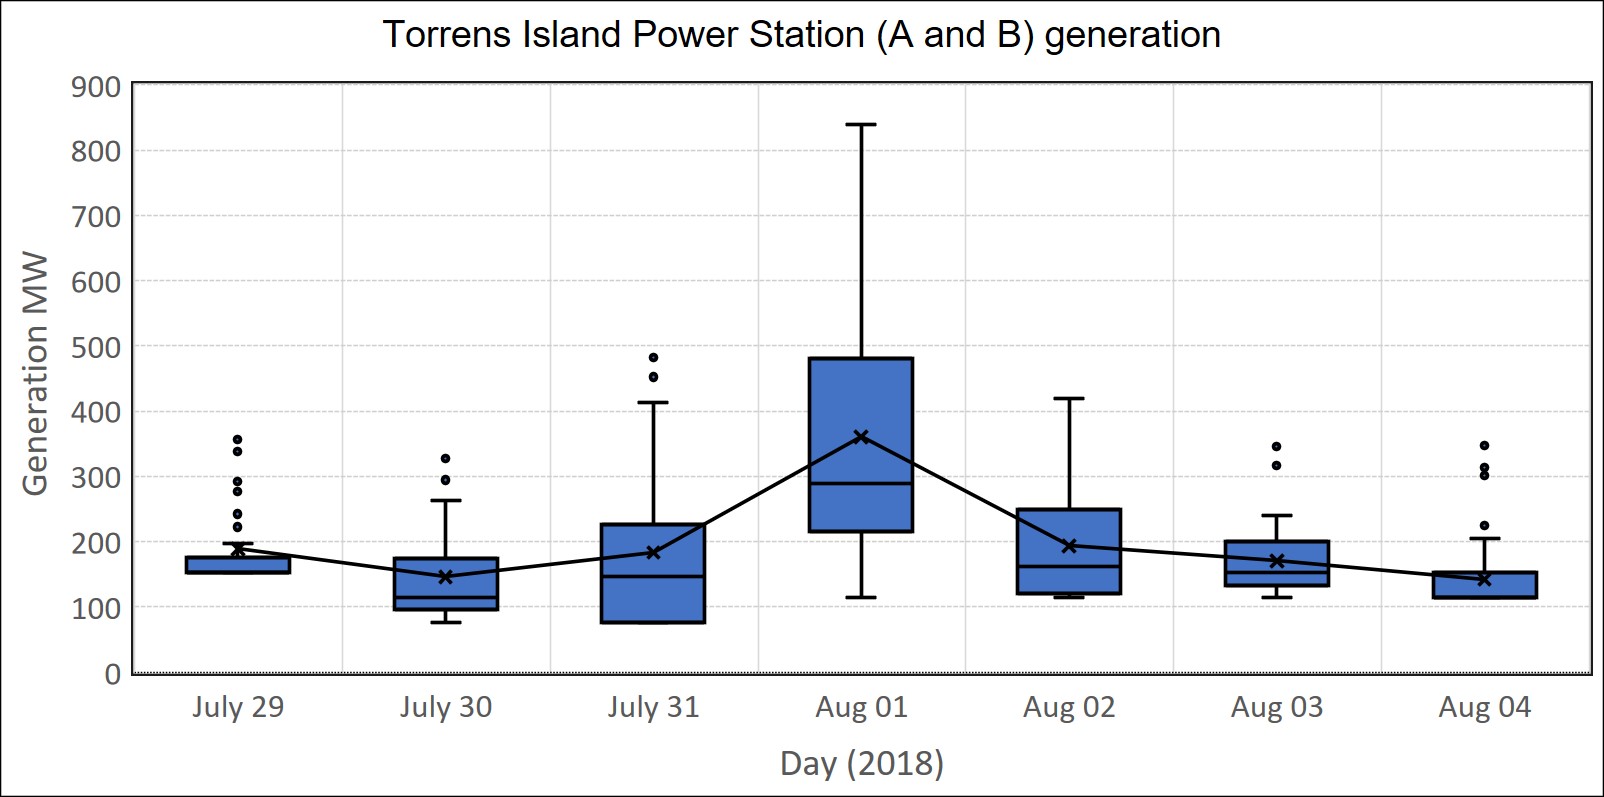 Figure 9 Torrens Island Power Stations (A and B) Daily Generation Box Plot (Data Source: NEMReview)
Open Cycle Gas Turbine (OCGT) generation (Figure 10) increased substantially on the 31st when the wind dropped off and continued to run at a modest output until the August 2nd. It made a small but important contribution on the August 3rd. It is important to note that usually OCGT generation runs for less than 50% of the day, when they are operating, as they are required to meet periods of higher demand, or rapidly increasing demand. During this week, OCGT only ran between 5:00am and midday and then from 16:30 to midnight.
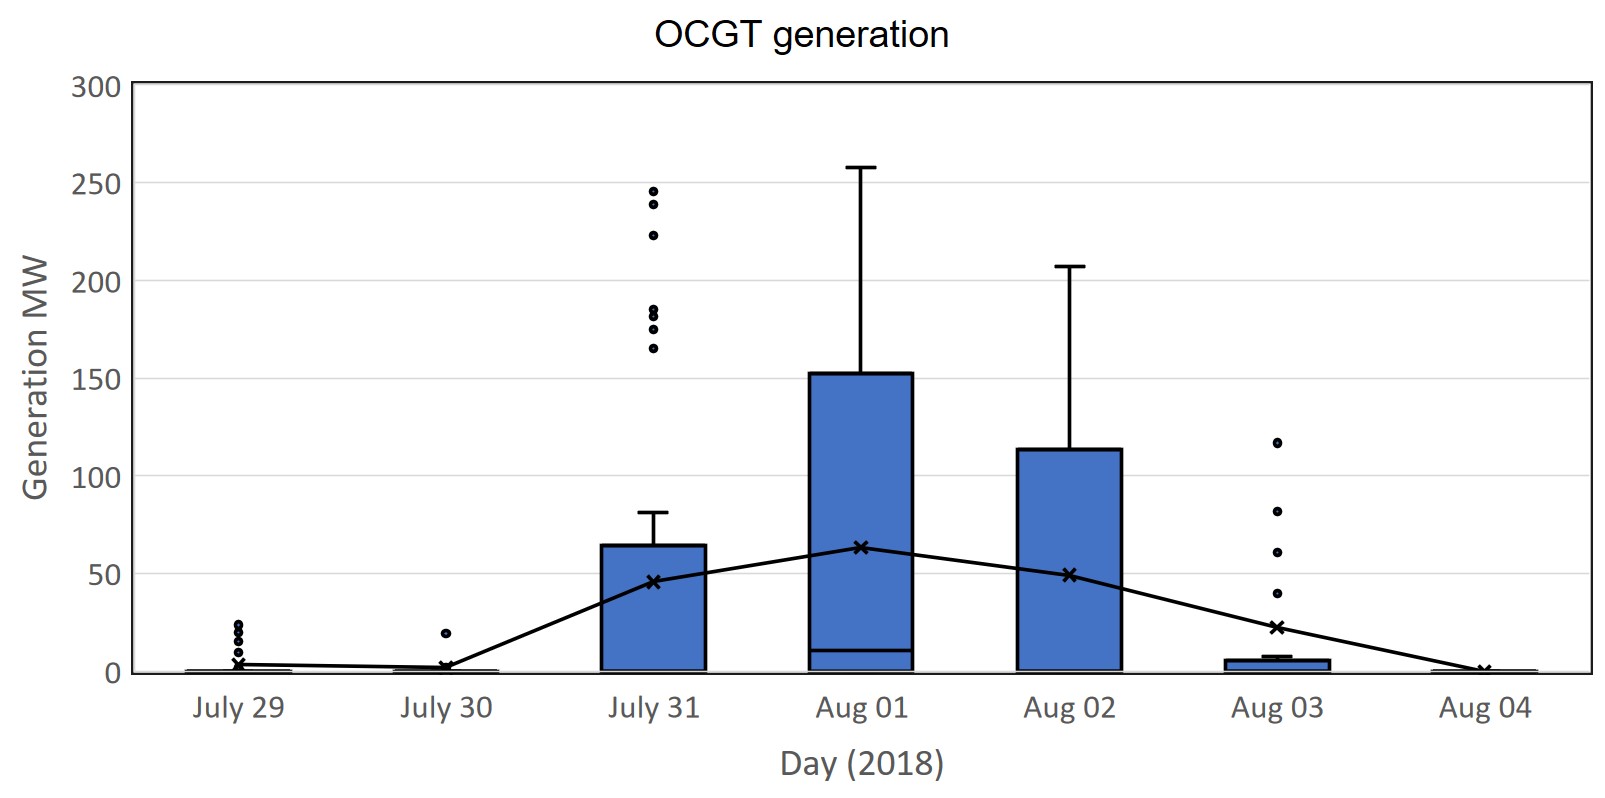 Figure 10 OCGT Daily Generation Box Plot (Data Source: NEMReview)
Diesel generation is usually only dispatched during high price events for short durations of time. Figure 11 shows that in this last week, it was dispatched for 17 half-hour periods or 6% of the time. Usually, it is dispatched during high price events but in this last week it was also dispatched during low and negative half-hour aggregate prices. This was likely due to individual 5-minute dispatch intervals being priced higher with diesel generation responding to the 5-minute dispatch intervals. The actual trading period half-hour price is determined by the average of the six 5-minute dispatch intervals. There were large swings in the 5-minute prices within individual half-hour trading periods.
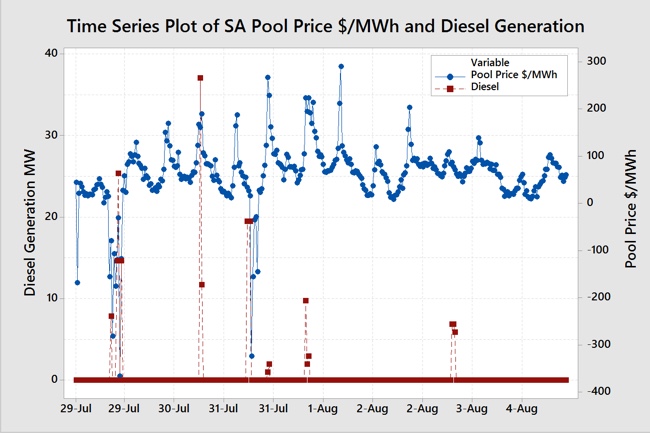 Figure 11 Diesel Daily Generation Box Plot (Data Source: NEMReview)
The Big Battery (Figure 12) provided support during periods of changes in both the demand and the generation mix, providing some stability to the system.
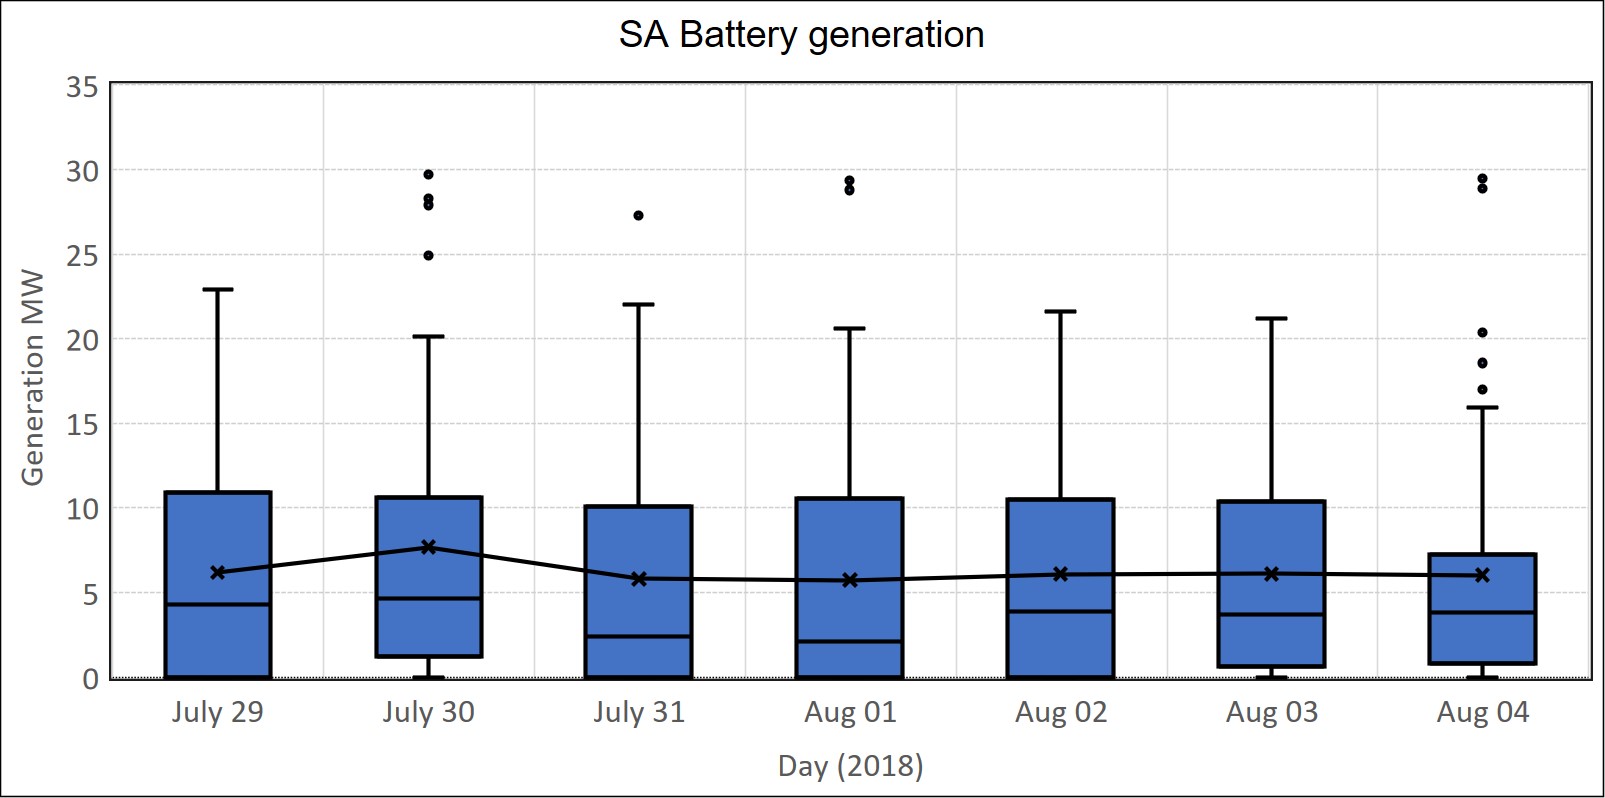 Figure 12 Battery “Generation” Daily Box Plot (Data Source: NEMReview)
The interconnector flows between Victoria and South Australia are shown in Figure 13. For the first three days of the week South Australia was predominantly exporting electricity to Victoria. On August 1st when the wind generation dropped to a very low level, SA largely imported electricity. It resumed exporting again on the 2nd August when the wind picked up with some imports on the 3rd August when gas generation output was low.
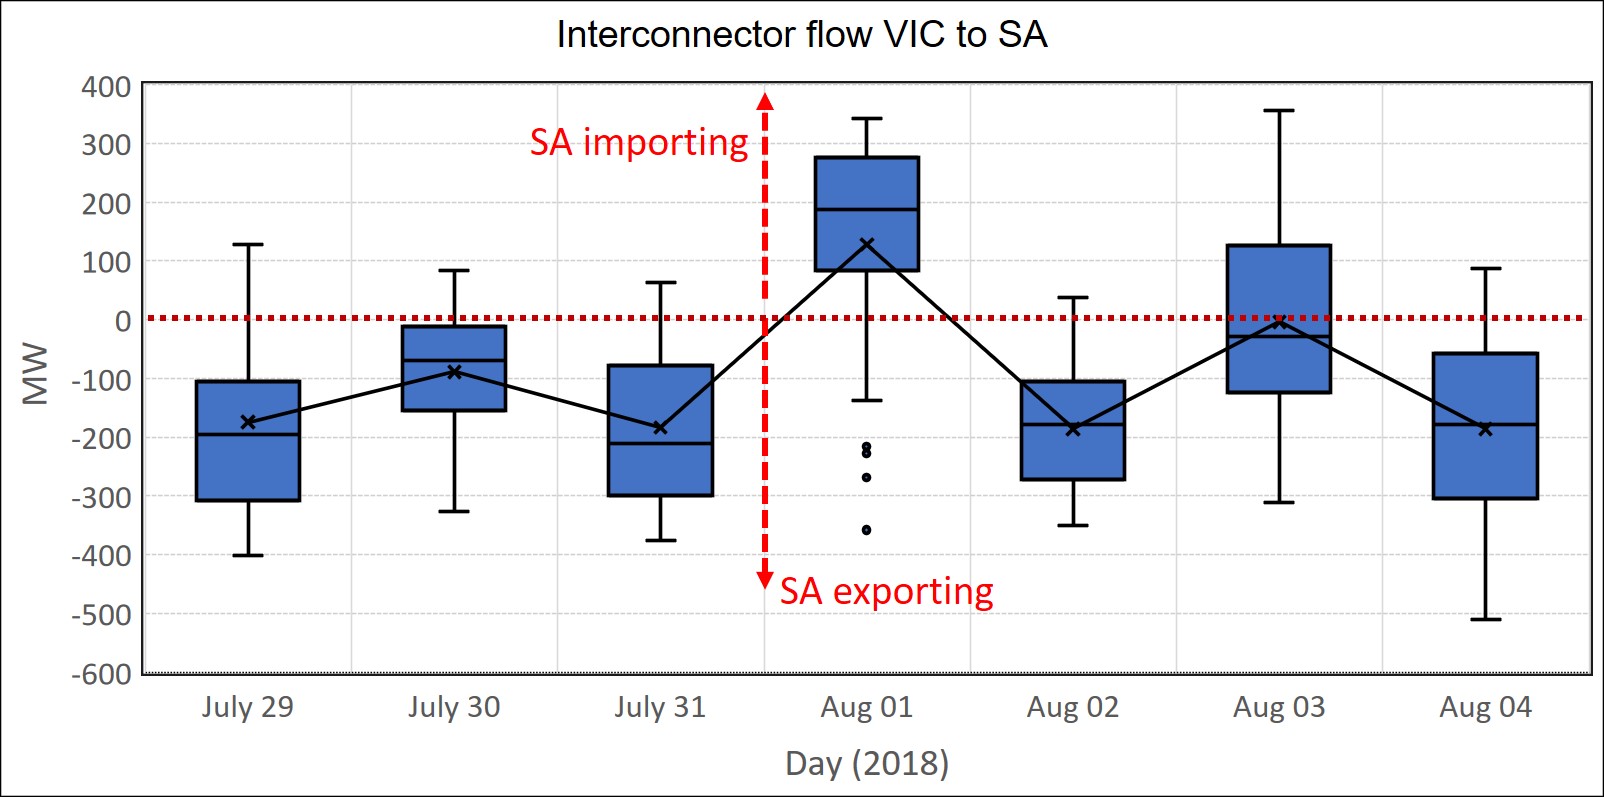 Figure 13 Victoria to South Australia Interconnector Flows Daily Box Plot (Data Source: NEMReview)
Rooftop solar continued to play a passive but important role during this week. The calculated rooftop solar (Figure 14) remained largely consistent during the week and contributed several hundred MW of “negative demand” during the peak solar periods in the middle of the day.
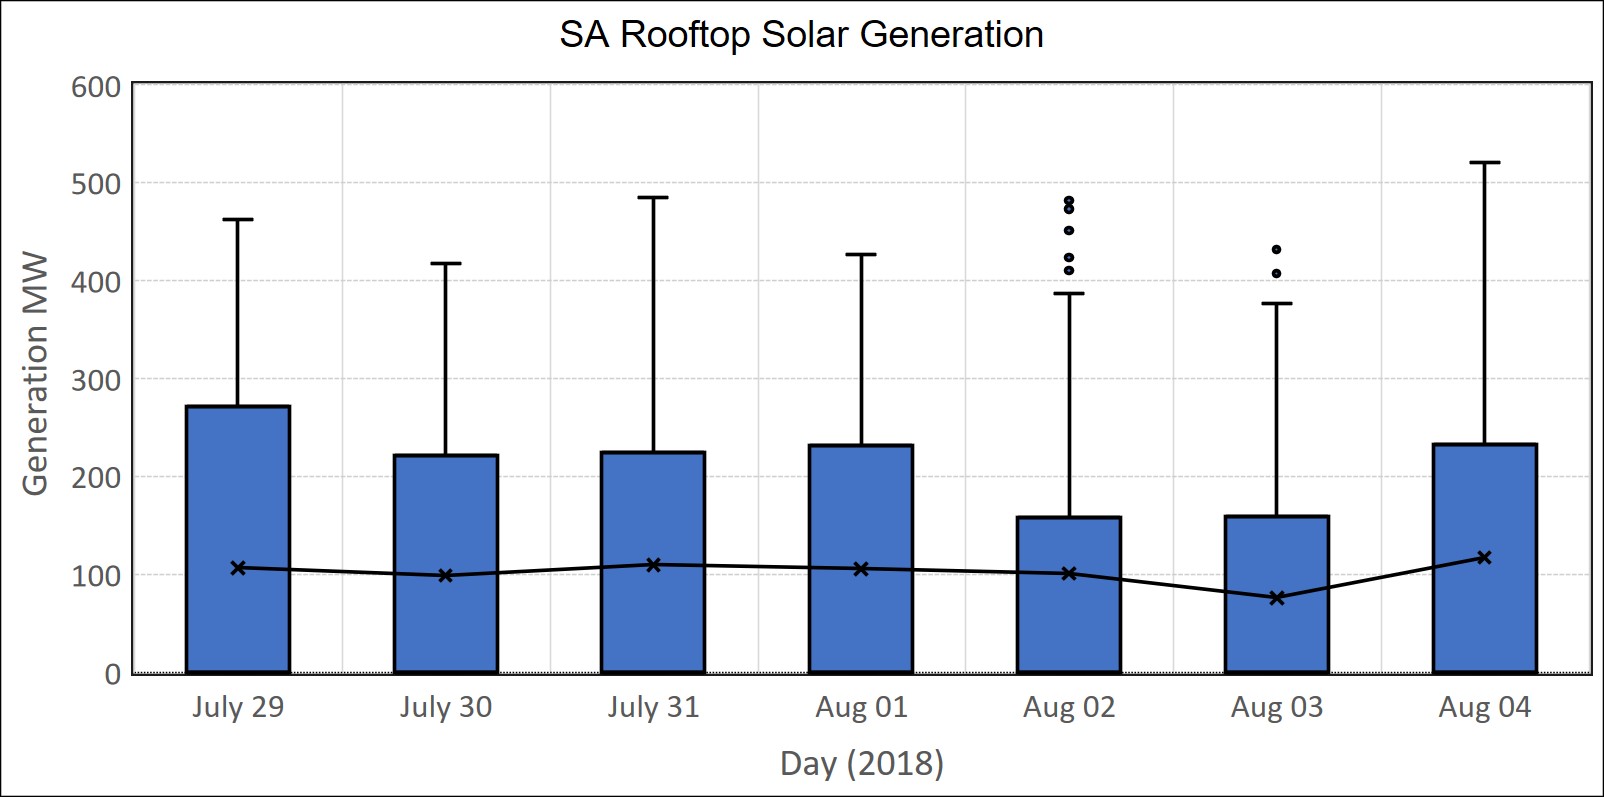 Figure 14 Calculated South Australian Rooftop Solar Daily Generation Box Plot (Data Source: NEMReview)
Two posts ago, we started to include the output from the newly commissioned Bungala One Solar Farm (Figure 15). This farm is producing up to 34 MW during peak solar periods. Probably due to local weather conditions (cloudy), generation was very low on the 29th July, 2nd and 3rd August.
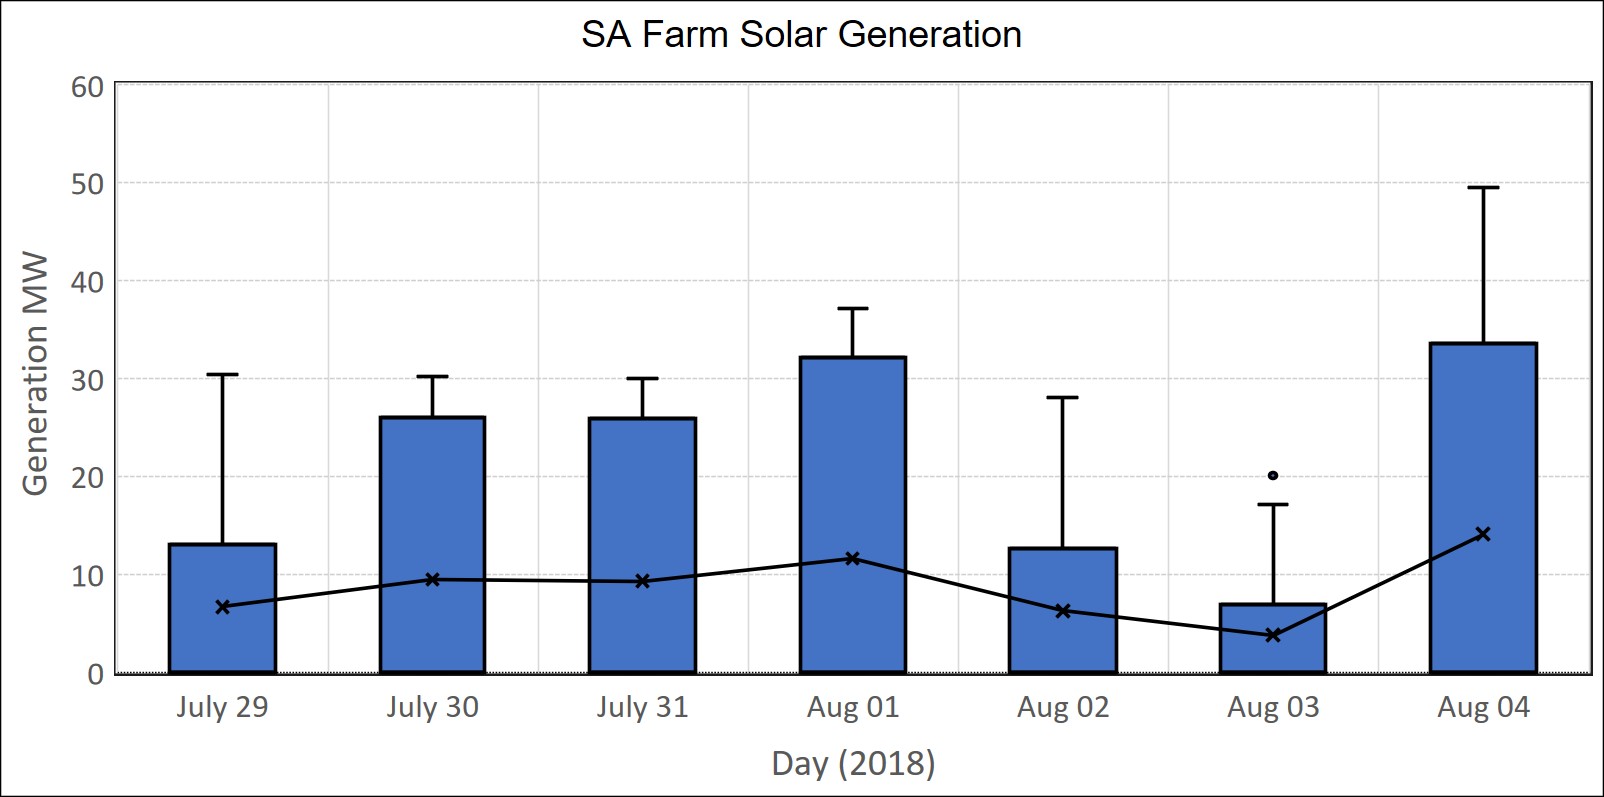 Figure 15 South Australian Farm Solar Daily Generation Box Plot (Data Source: NEMReview)
The major feature of the week was a relatively large number of half-hour periods with negative prices.
The periods with the negatives prices are in the first three days of the week and are shown in Figure 16.
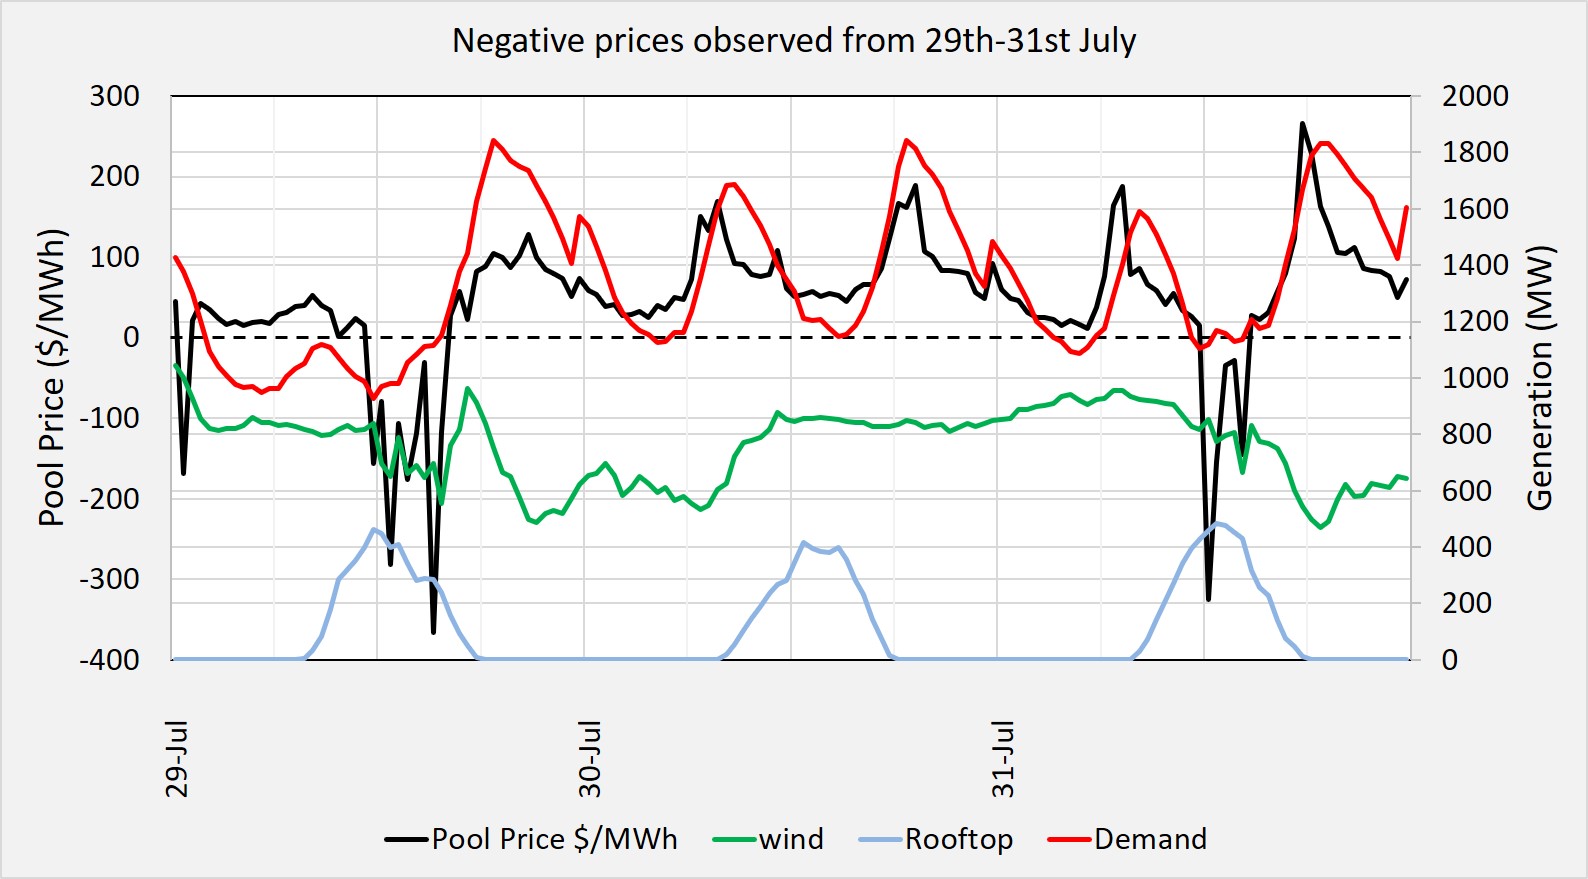 Figure 16. Negative pool prices compared to Demand, Solar, Wind and Rooftop Solar generation (Data Source: NEMReview).
The periods of lowest pool price (black line) coincide with afternoon periods when wind (green) and solar rooftop (blue) generation were considerably high and when Demand (red) was low.
The lower demand is explained partially by the way that it is calculated in that non-scheduled wind generation and rooftop solar power are treated as “negative demand”.
In summary, the major features of the week were:
- the average pool price was $61.09/MWh, a reduction of 34% when compared to the previous week’s price of $93.10/MWh
- There were 12 half-hour periods of negative prices
- the Wind Generation was high for six of the seven days of the week
- there were no pool price spikes higher than $300
- Diesel generation was utilised for 17 half-hour periods despite the low prices
- Osborne power station was not operational from 2nd August
- energy was exported to Victoria for most of the week except during the period of low wind generation (August 1st) and for half of the time on 3rd August
Why is it important for end users to understand what is happening in the wholesale electricity market, what drives prices and the price patterns that occur?
It helps end users to understand what is happening to their electricity prices along with the underlying causes so they can make informed decisions.
Those end users who choose to purchase their electricity through wholesale market pass-through prices can gain a better understanding of how they can manage their risk through load shifting and load curtailment (Demand Side Management and Demand Response).
If you would like to understand more about how the electricity market works and how business end-users can reduce their electricity prices then check out my book Power Profits – A Comprehensive 9-Step Framework For Reducing Electricity Costs and Boosting Profits.
If you would an updated SA market weekly report emailed to each week then drop me a line at michael@altusenergy.com.au
