
The first week of Winter in South Australia saw an increase in wholesale market electricity pool (spot) prices with very low wind on all but three days of the week. The week started with almost no wind generation but on Wednesday 6th June the wind came back displacing interconnector imports and a large amount of the gas generation, particularly the Open Cycle Gas Turbines (OCGT). On Thursday 7th of June as the wind picked up further, generation output at Pelican Point, Torrens Island, and even Osborne was reduced as wind generation dominated the generation mix. The wind disappeared on Saturday 9th bringing back the gas generation, including OCGT, pushing prices back up.
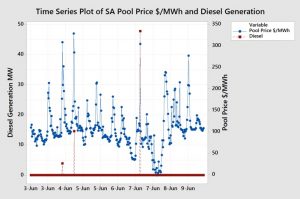
The charts below shows time series plot of half-hour electricity prices and wind generation over the week.
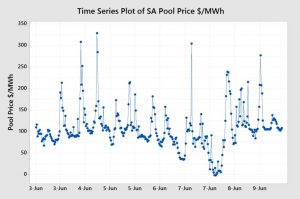
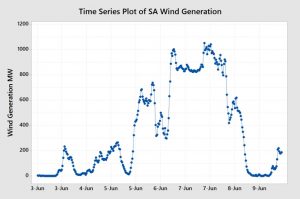
The plots lined up next to each other show the impact that wind generation has on pool prices with the wind driving down prices mid-week. Of course, the demand cycles over the day also have an impact on price. The demand time series and box plot are shown below.
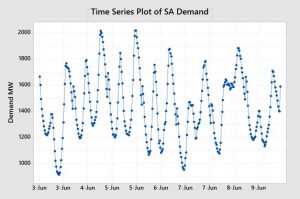

The demand box plot simplifies the cyclical demand data and shows the distribution of the demand half-hour data for each day. As there is an overlap between wind generation and demand (some of the wind generation is treated as negative demand), the higher wind generation days on the 6th and 7th also show lower demand.
The box plots for daily distribution of both pool prices and wind generation are shown below.
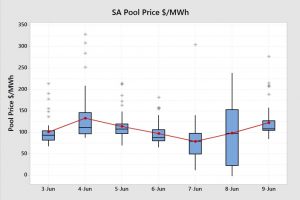
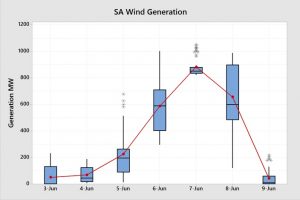
The 3rd of June had almost no wind but as the wind picked up later in the week prices dropped. The time series plot of wind reviewed earlier saw a sharp drop off during Friday 8th resulting in more volatile pricing, as indicated by the size of the box in the pool price box plot.
So how did this fluctuation in wind generation impact the generation behaviour of the generation types during the week and consequently the prices?
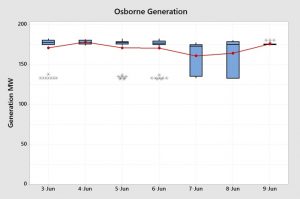
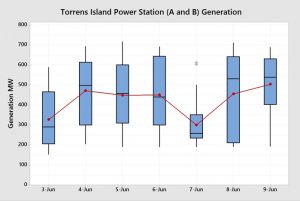
The ever-reliable and consistent Osborne Power Station ran at a very steady load over the week with some generation displaced on the 7th and 8th as Torrens Island or Pelican Point outbid some of its capacity to supply the small amount gas generation required to meet demand after the wind generation. Torrens Island Power Station (TIPS) ramped up and down each day to meet demand competing for supply with both Osborne and Pelican Point.
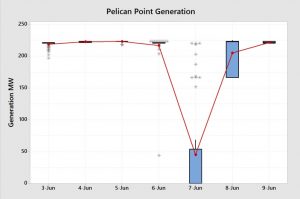
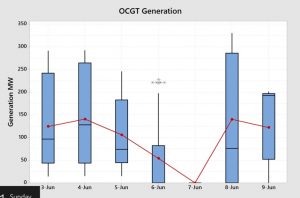
Pelican Point ran steadily in the first half of the week with still only one unit online. On Thursday the 8th it was largely outbid by TIPS and Osborne to supply the small amount of gas generation required to meet demand. OCGTs had a high amount of usage in the first three days, likely setting the price. OCGT dropped away markedly on Wednesday 6th and nothing generated on Thursday 7th, resulting in much lower prices. OCGT output started increasing again on Friday 8th as wind generation dropped and had a large median output on Saturday 9th resulting in higher prices.

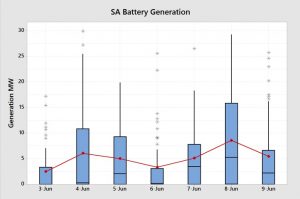
Solar generation dropped away on the higher wind generation days due to cloudy weather and the Big Battery was utilised fairly consistently during the week. Note that battery output was considerably higher on Friday 8th as wind generation dropped away.

As expected, on the first three days of the week (commencing Sunday 3rd), SA almost exclusively imported electricity from Victoria through the two interconnectors but this flipped on Wednesday when the wind picked up and SA almost exclusively exported to Victoria. This flipped back again on Saturday when SA imported from Victoria as the wind died down again.
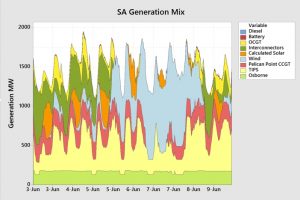
We can see the sum of all of the generation output in the below generation mix graph. The impact of the light blue coloured wind generation can be clearly seen in the chart with some periods having only Osborne, a small amount of TIPS and wind supplying all of the demand.
How did the generation mix resolve into a wholesale market pool price outcome for the week.

The box plot showing all of the half-hour periods shows an average price of $106.55/MWh and a median price of $102.28/MWh. The number of price spikes were quite small and also small in magnitude and so the average price is close to the median. The whole distribution of prices shifted upwards compared to last week due to the large reliance on OCGT.
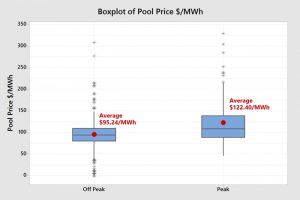
Peak period prices averaged $122.45/MWh and Off-peak period prices averaged $95.24. These prices are not too dissimilar to fixed retail prices that many customers are exposed to. They are considerably above the level that some Early Adopters are enjoying, or will enjoy, with the emerging style of renewables PPAs backed by firming capacity as announced here.
So how can all this information assist end users?
Some end users are fully or partially exposed to the spot price. They can use this information, when applied to a longer term, to understand what is happening in the market to formulate a view on how market prices will play out for the remainder of the year. End users who are not exposed to the wholesale spot price can use this information to form a view on expectations for fixed retail price offers. They can also use this information to schedule operations based on price expectations by time-of-day or plan maintenance days when there are forecast low wind generation and/or temperatures exceeding 35oC.
More importantly, those end users who do not understand the market well can utilise this information to start building their knowledge. They can predict increases or decreases in fixed retail prices and evaluate whether retail prices or renewables PPAs are fair or not.
My new book Power Profits shows end users how the market operates and they can take advantage of that knowledge. It provides a comprehensive 9-step framework for reducing electricity costs and boosting business profits.
If you would like to learn more, check out the book here, available in hard copy or as a Kindle Ebook.
If you would this weekly report emailed to you then drop me a line at michael@altusenergy.com.au
Acknowledgment and thanks to Paul McArdle of Global-Roam for providing the raw data through the NEMReview software.