Prices increased in the week of 22nd – 28th July due to one high price spike on Saturday the 28th when wind generation and imports from Victoria dropped to almost zero during the morning high demand period. High-cost Open Cycle Gas Turbine Generation (OCGT) and diesel generation were required to meet demand during this period. The average price was $93.10/MWh compared with the prior week of $76.20/MWh.
Figure 1 shows a box plot (excluding outliers) for daily half-hour price distributions over the week-long period. The median pool price for the week was $80.76 compared with the mean price of $93.10. The week saw some negative prices as well as the $3,985.64/MWh price spike that pulled the average up above the median.
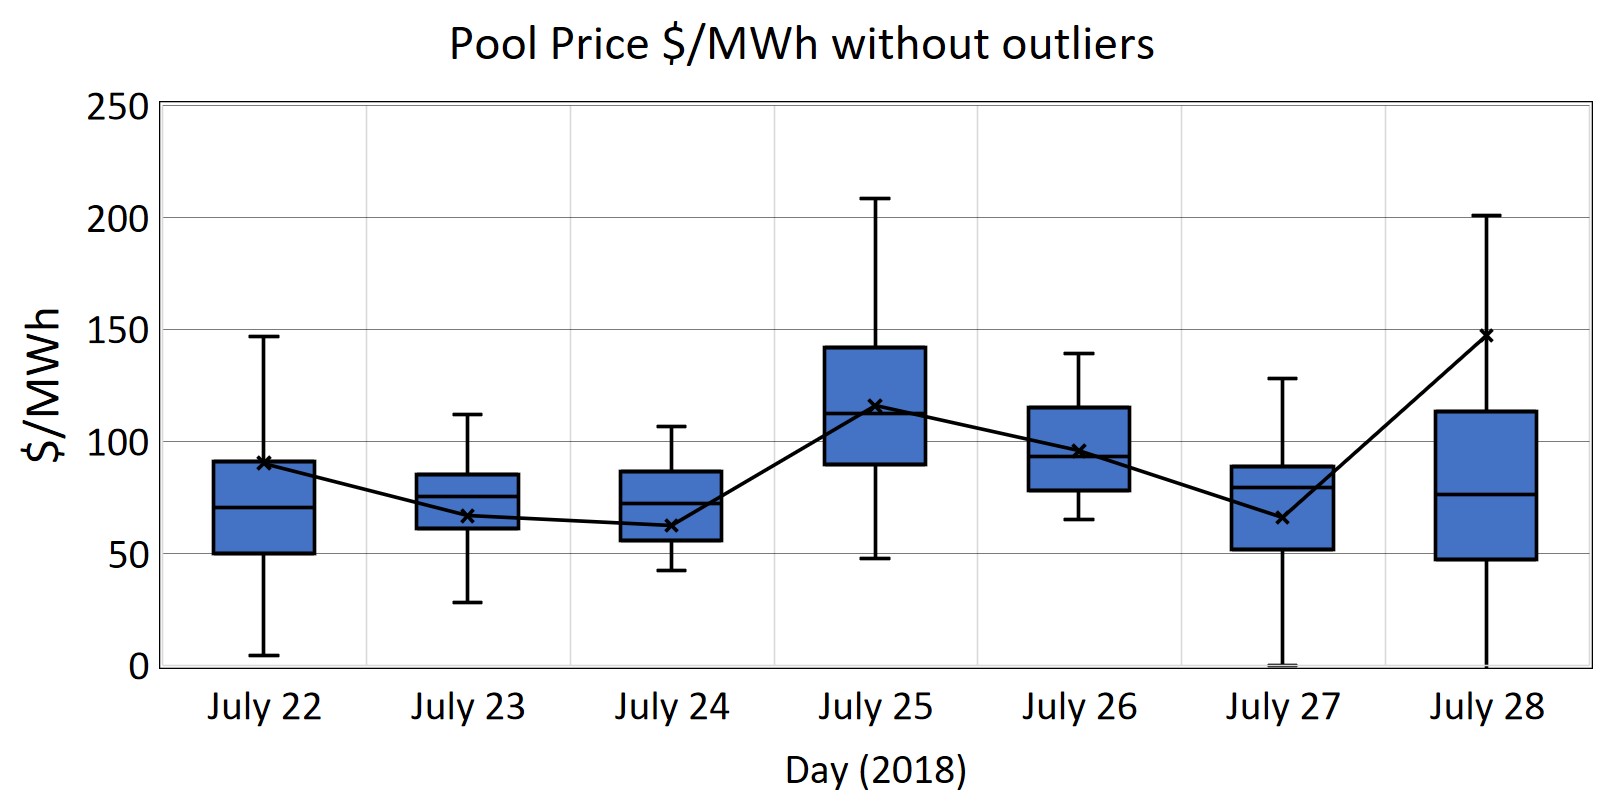 Figure 1. Daily SA Pool price box plot (Data Source: NEMReview)
The SA demand time series shows the typical winter pattern with two clear peaks per day: one peak in the morning when people wake up and the second when they arrive home after work in the early evening. There is also a short smaller spike at midnight when many hot water services kick in. It was during a morning higher demand period that the price spike occurred.
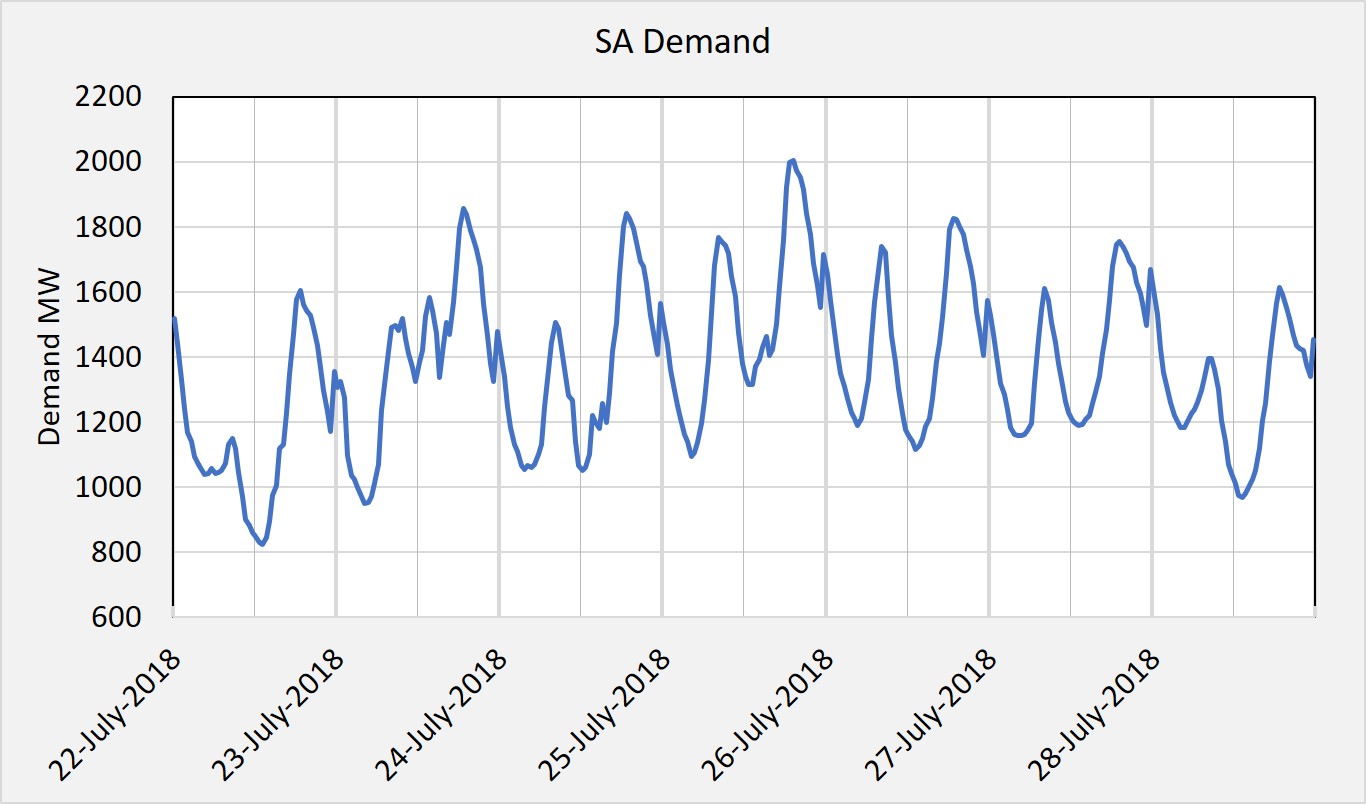 Figure 2. SA Electricity Demand Time Series (Data Source: NEMReview)
The three demand spikes and the low demand troughs are reflected in the pool price pattern. Figure 3 shows a box plot of pool prices for each half-hour period of this week. Higher prices are observed in the early morning, in the evening and at midnight when demand peaks. Lower prices, even negative prices, are observed during the middle of the day. This is due to low demand coupled with high rooftop solar generation. Prices are also lower overnight excluding the midnight peak when demand is low and wind generation tends to be higher.
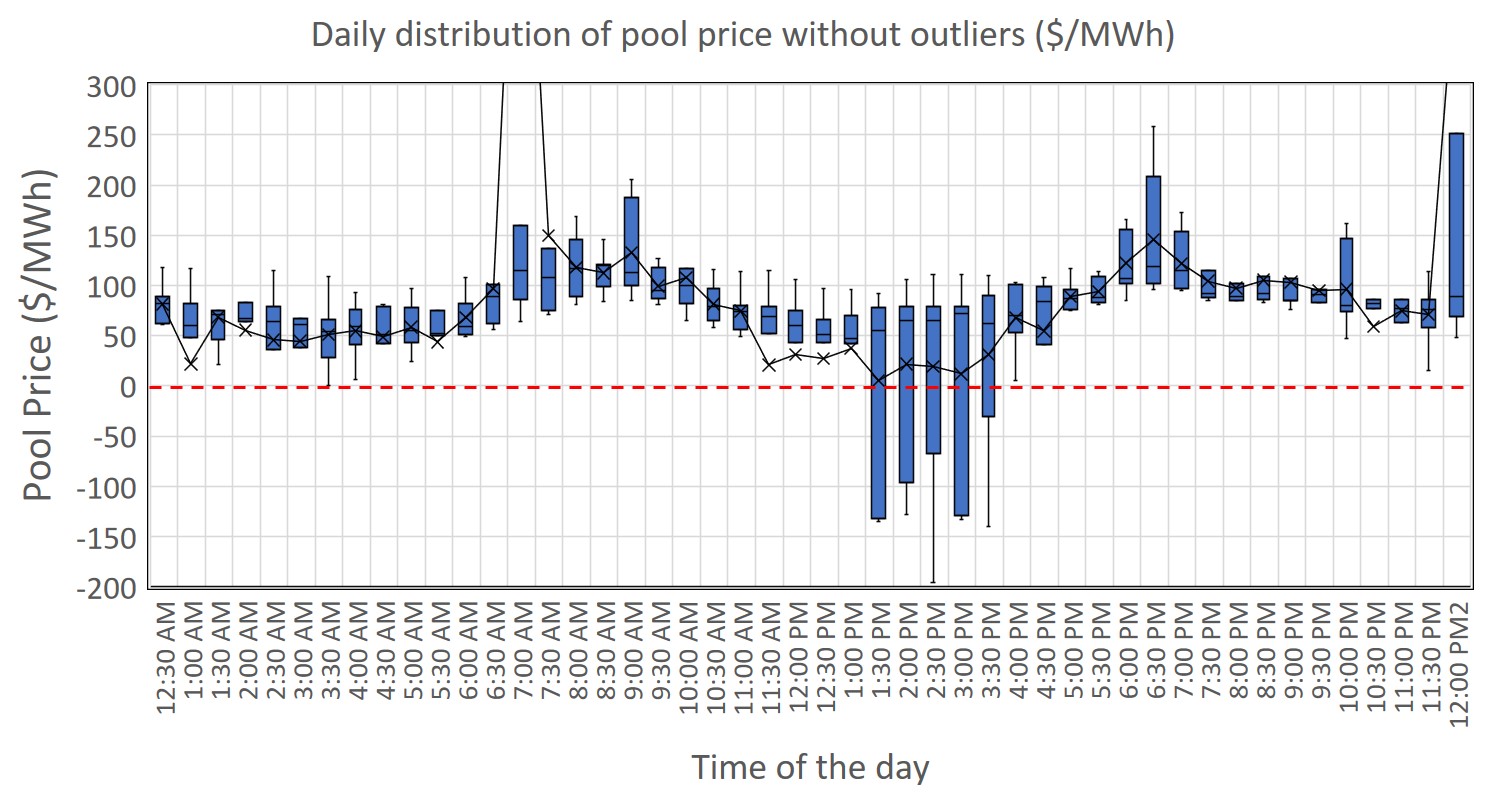 Figure 3. South Australian Daily Pool Price By Time-Of-Day Box Plot (Data Source: NEMReview)
The generation mix for the week shown in Figure 4 clearly shows three days of strong wind generation (orange) from July 22nd to July 24th followed by four days of low wind generation. Prices picked up on the 25th in response to the drop away in wind generation. It can also be seen that the Osborne Power station started up on the 24th and Pelican Point ramped up generation from the 25th July. Osborne and Pelican Point ran at relatively steady loads after ramping up and Torrens Island Power Station (TIPS) ramped up and down to meet demand after wind.
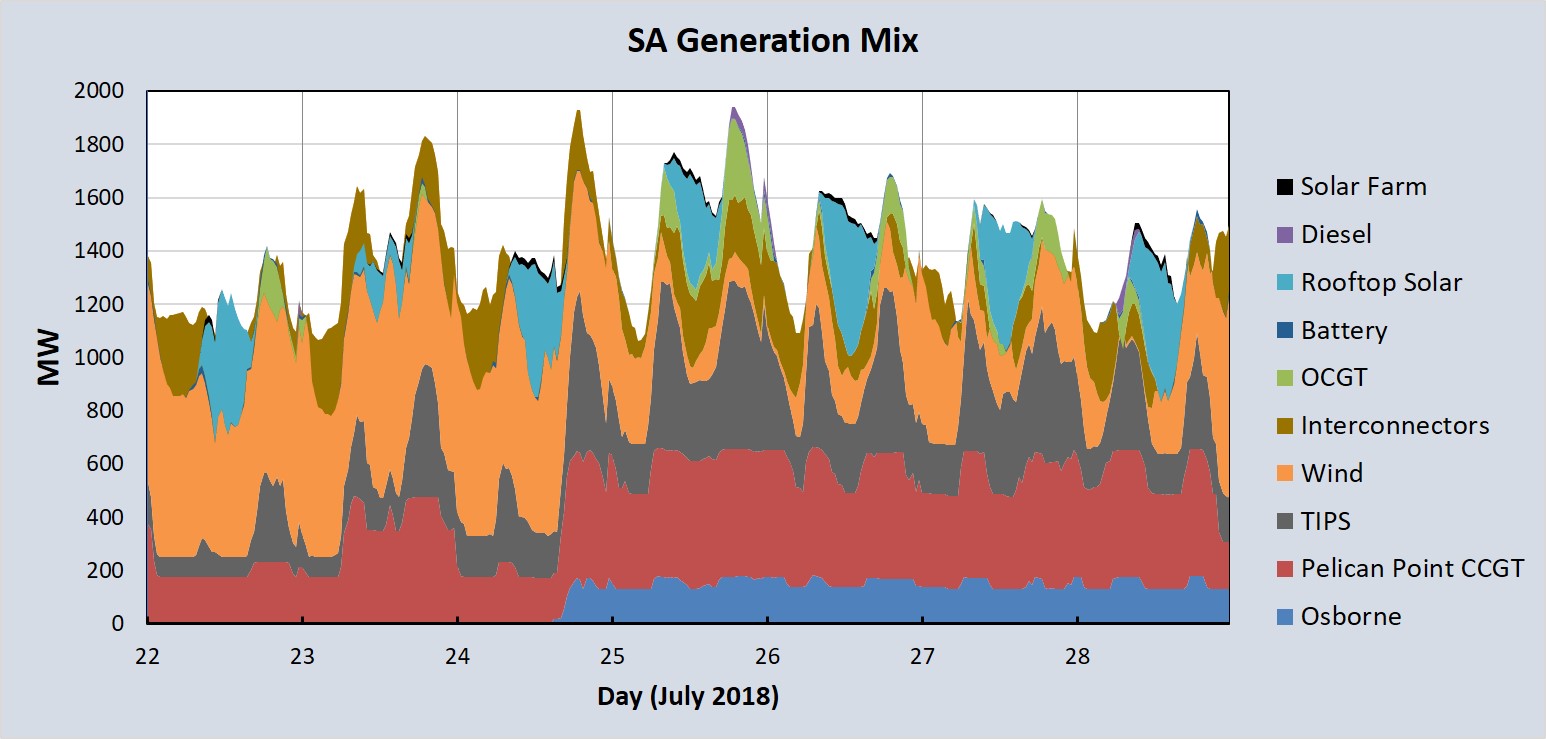 Figure 4. South Australian Generation Mix (Data Source: NEMReview)
Figure 5 shows that the wind generation was significant and steady during the first 3 days of the week and drops away to low levels for the remaining 4 days of the week.
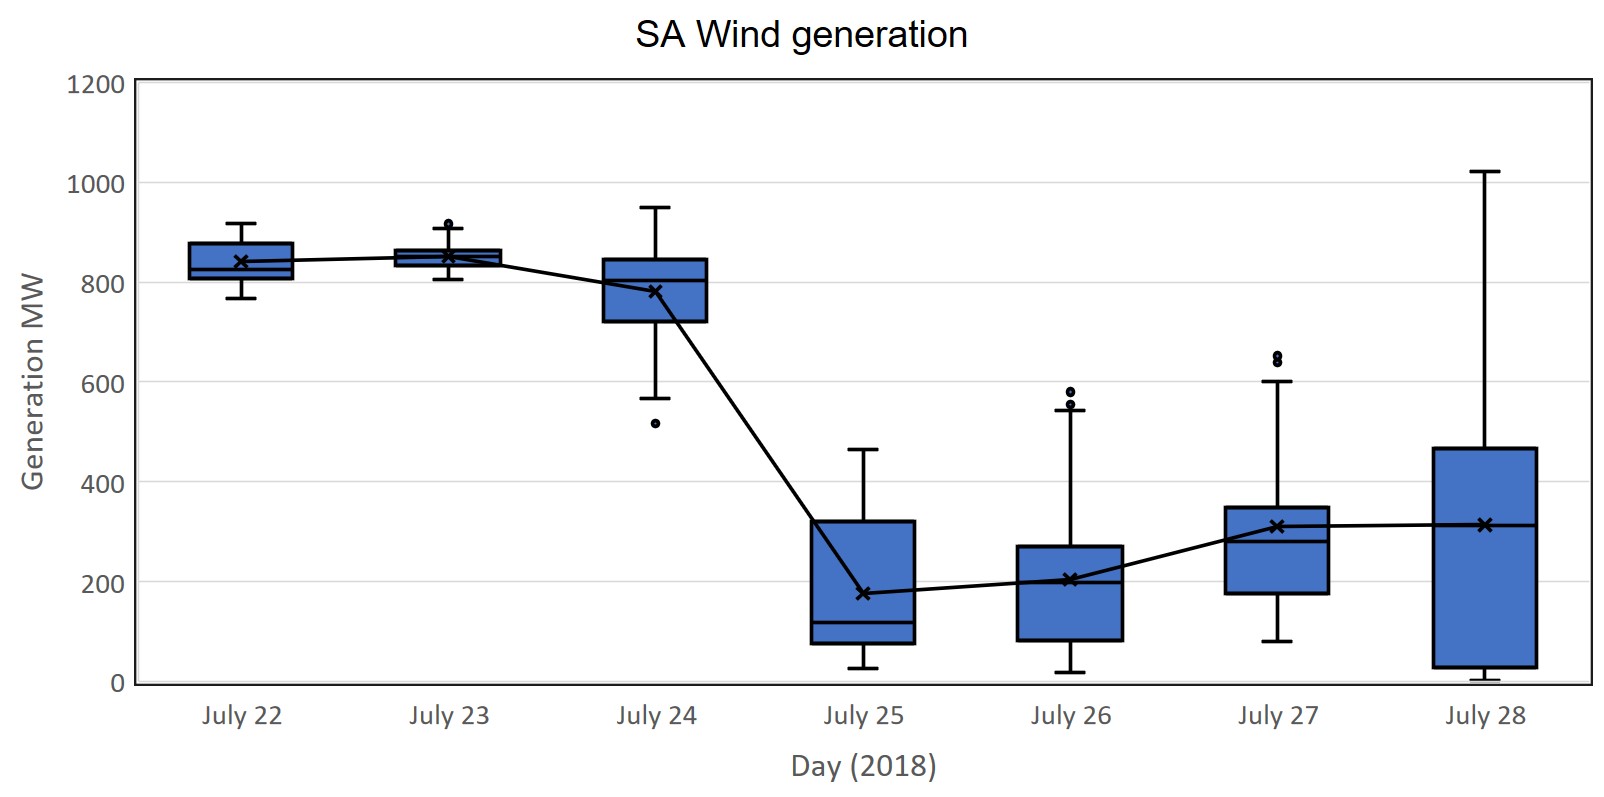 Figure 5. Daily SA wind generation price box plot (Data Source: NEMReview)
Pelican Point (Figure 6) began the week with one unit operational and started the second unit on the 23rd with both lines running at near capacity from the 25th.
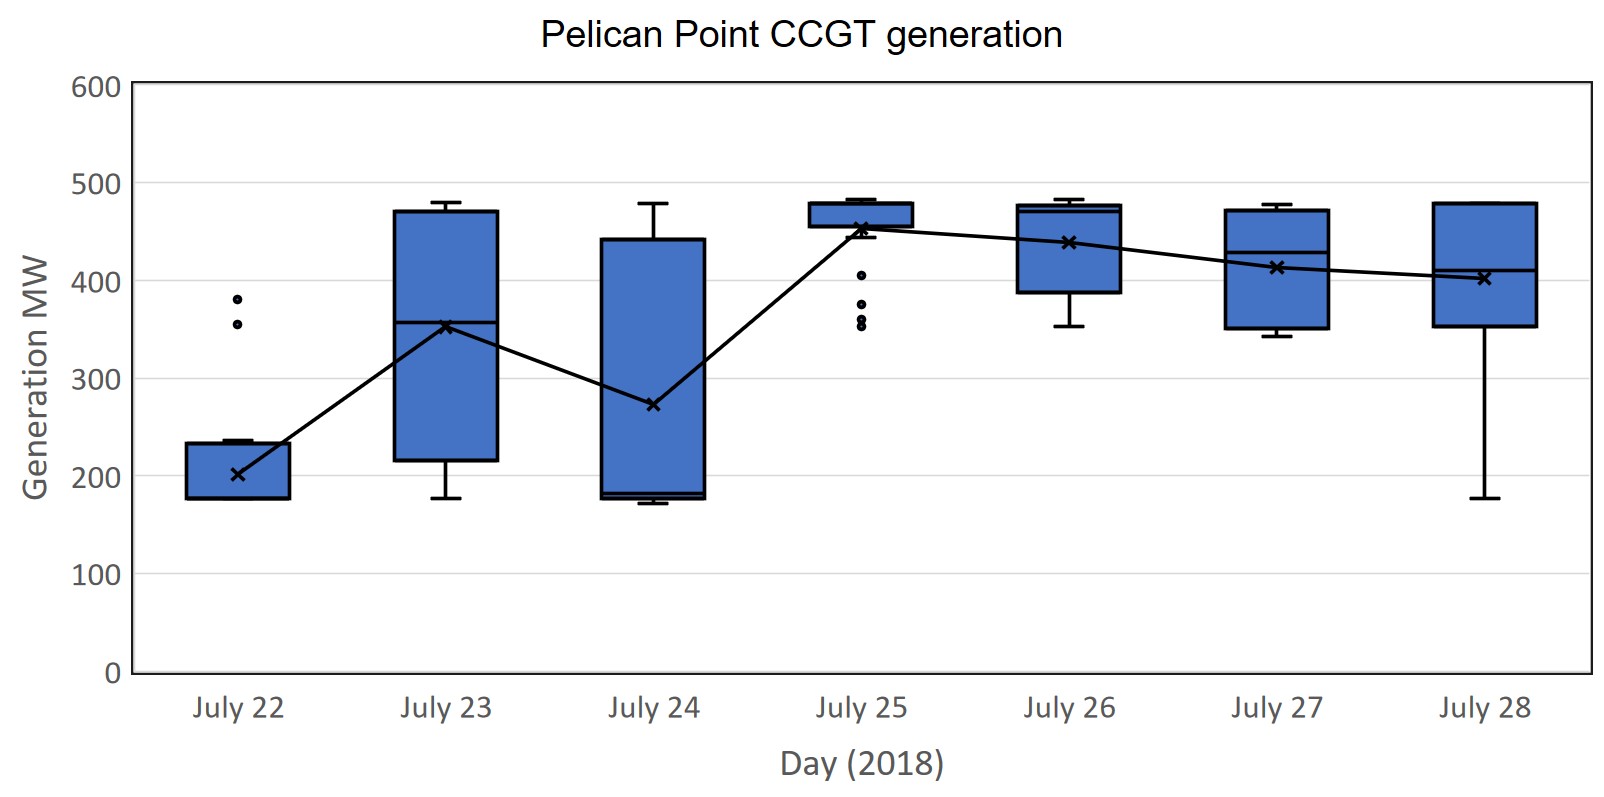 Figure 6 Pelican Point Power Station Daily Generation Box Plot (Data Source: NEMReview)
The Osborne Power Station (Figure 7) which was off, likely for maintenance, since July 13th, restarted operations this week on July 24th and remained at near capacity for the remainder of the week.
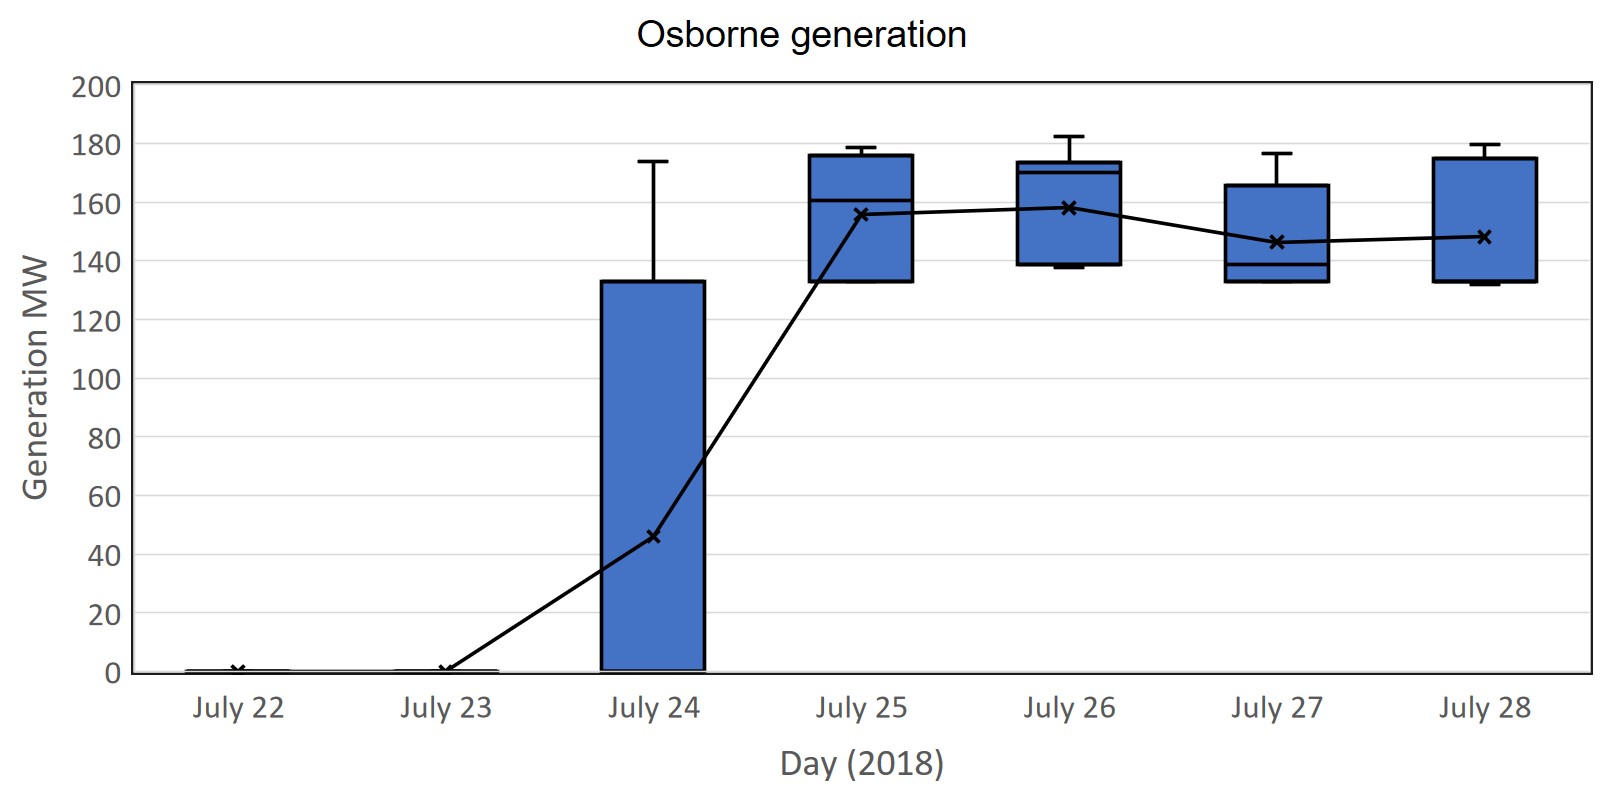 Figure 7 Osborne Power Station Daily Generation Box Plot (Data Source: NEMReview)
The Torrens Island Power Station (TIPS A&B) has a large variation in daily half-hour generation as it tends to have a bidding strategy that prices a larger portion of its generation capacity at prices above Osborne and Pelican Point generation prices. This means that it ramps up and down to meet the demand that is not met by Osborne, Pelican Point and wind generation. TIPS ran at a low output on Sunday 22nd but ramped up on Monday 23rd as demand increased and from the 24th when wind generation dropped away.
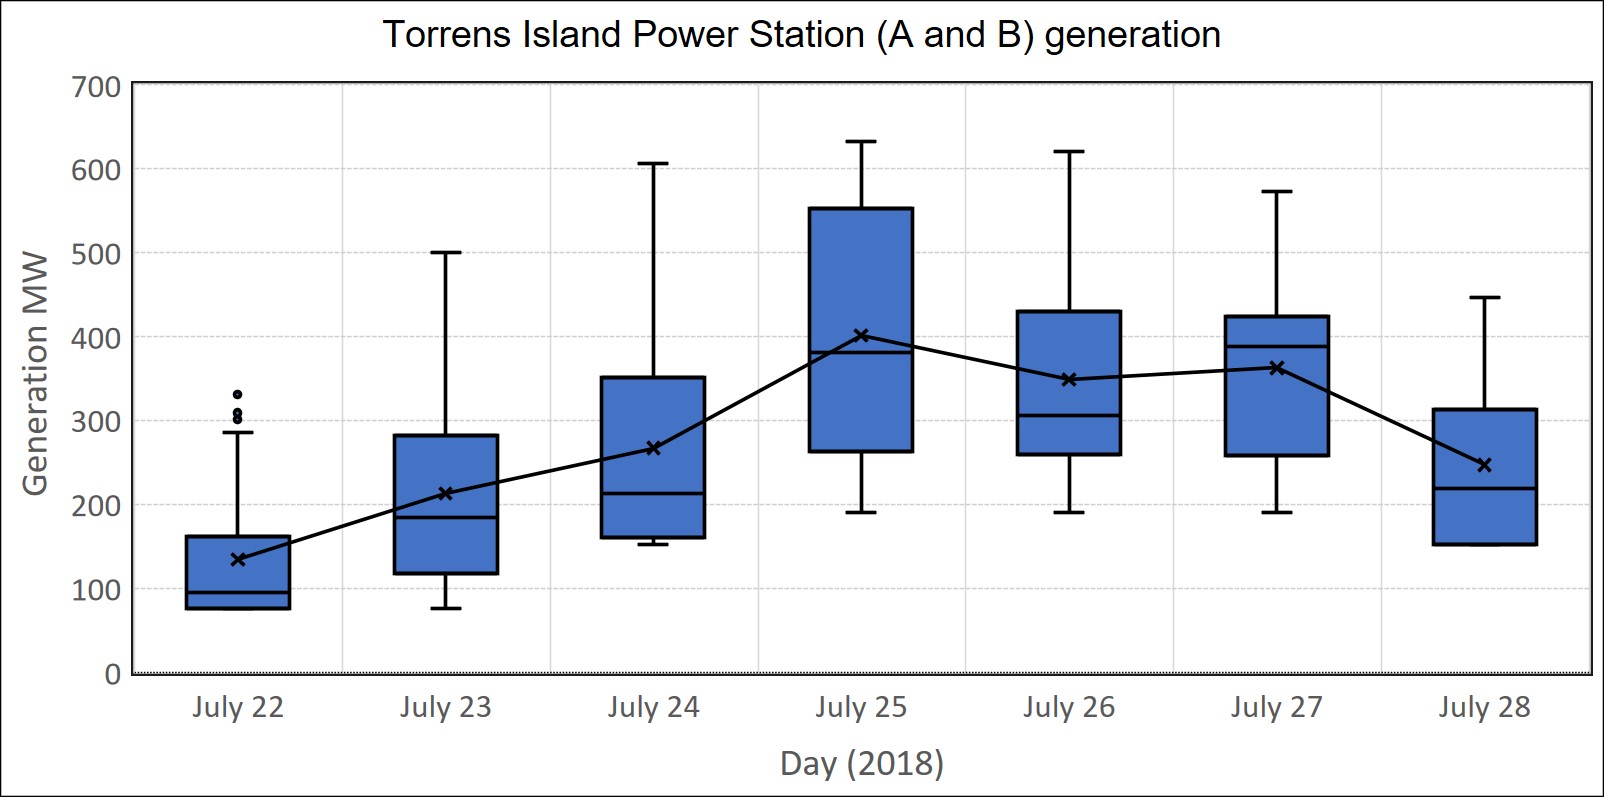 Figure 8 Torrens Island Power Stations (A and B) Daily Generation Box Plot (Data Source: NEMReview)
Open Cycle Gas Turbine (OCGT) generation (FIgure 9) increased substantially on the 25th when the wind dropped off and continued to run at a modest output until the 27th. It made a small but important contribution on the 28th.
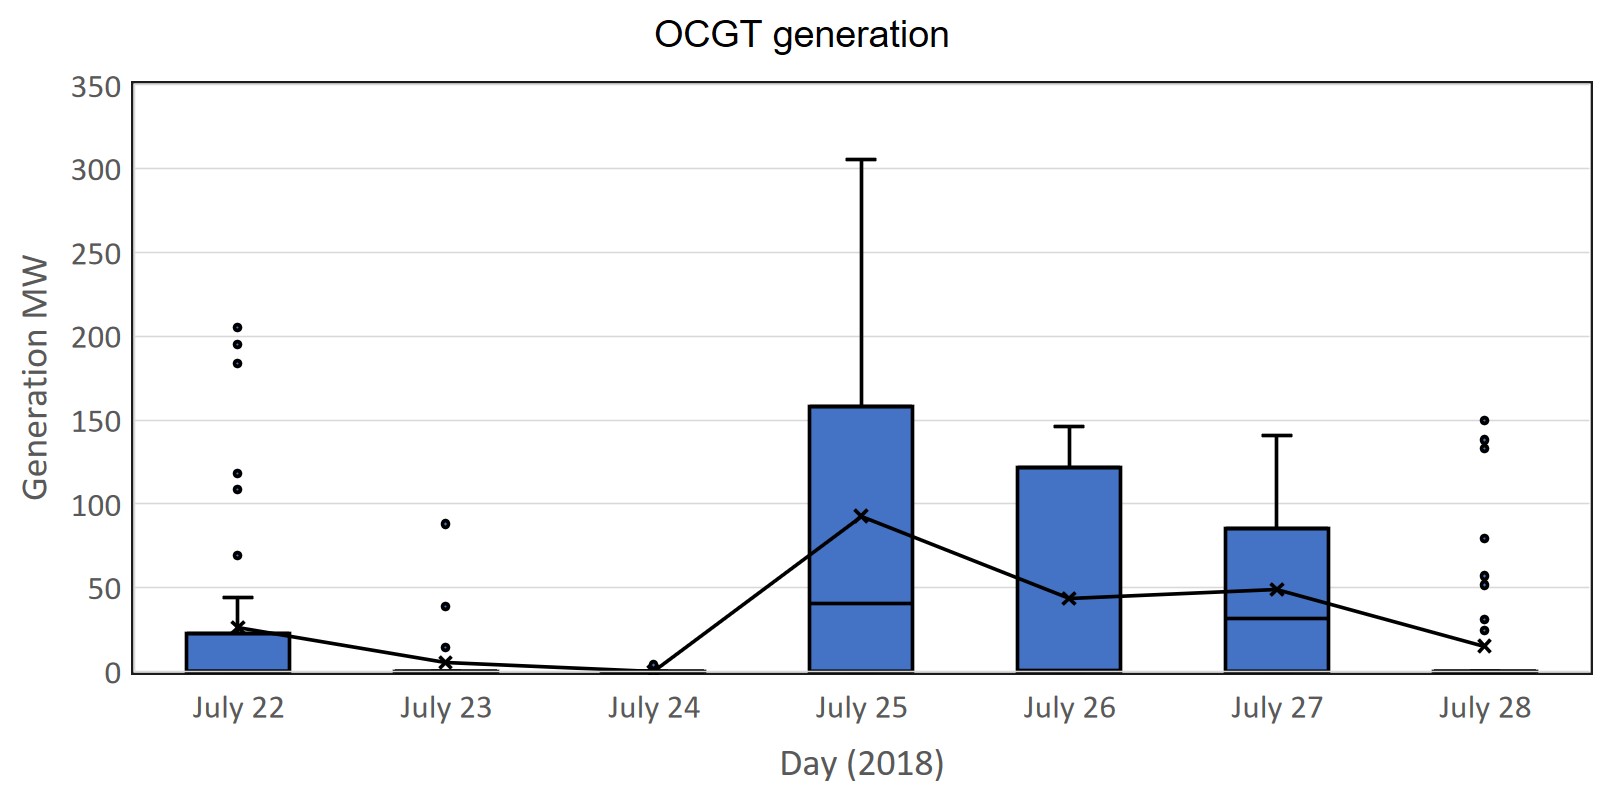 Figure 9 OCGT Daily Generation Box Plot (Data Source: NEMReview)
Diesel generation (Figure 10) was operated on 5 days of the week with a relatively high amount of generation on the 28th. This was due to a small period in the early morning when the wind generation dropped to almost zero at a period of increasing demand and very little imported electricity from Victoria.
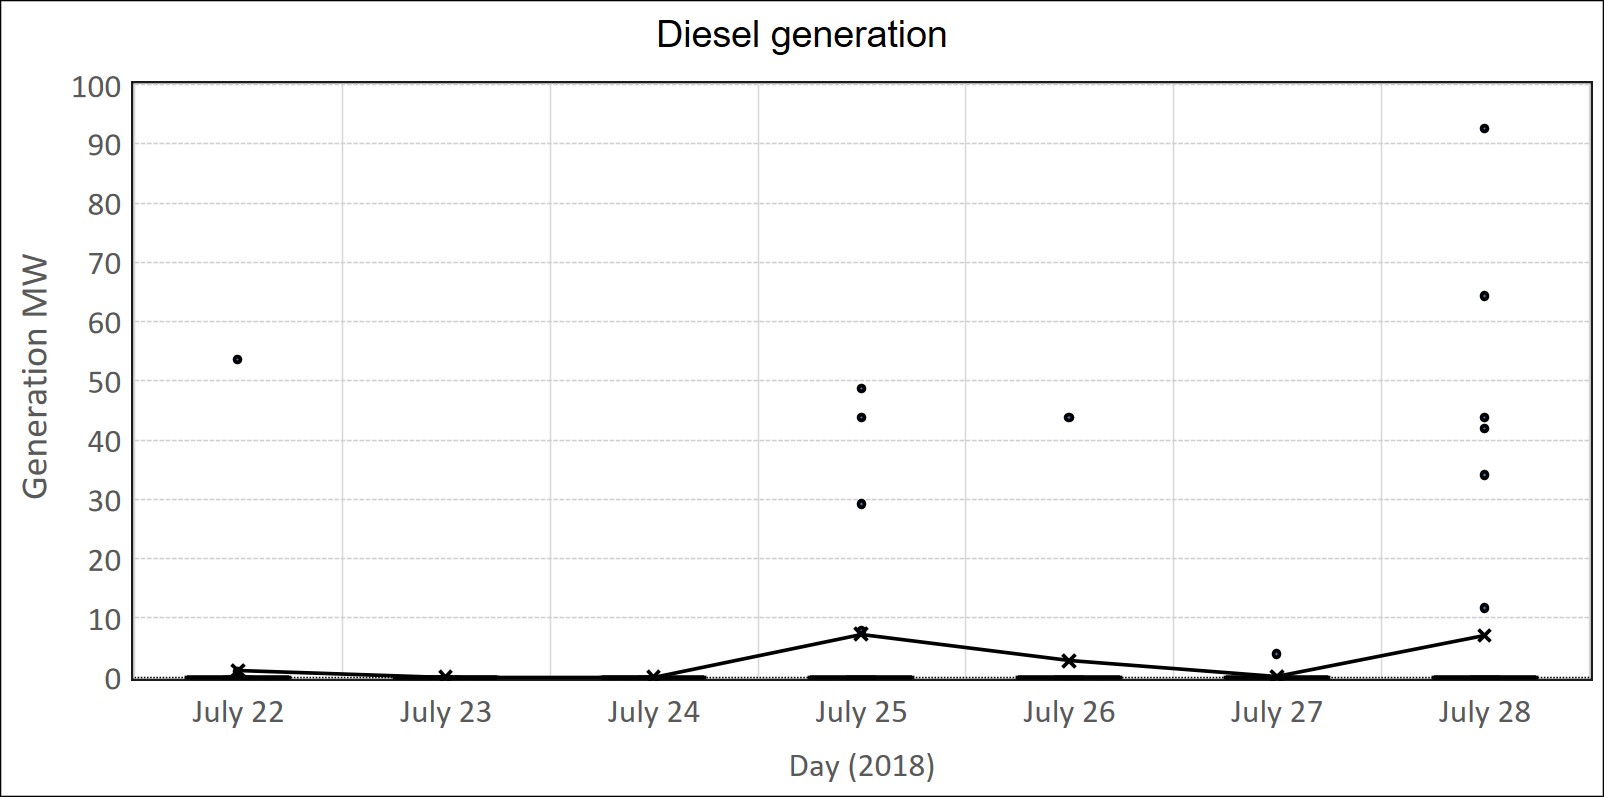 Figure 10 Diesel Daily Generation Box Plot (Data Source: NEMReview)
Figure 11 shows the impact on prices when diesel generation is required. The chart shows prices using a logarithmic scale on the right-hand side. About 40 MW of diesel generation is seen to be activated when prices reach $200/MWh and if more diesel generation is required to meet demand, prices can rise up to several thousand $/MWh as it did on the 28th.
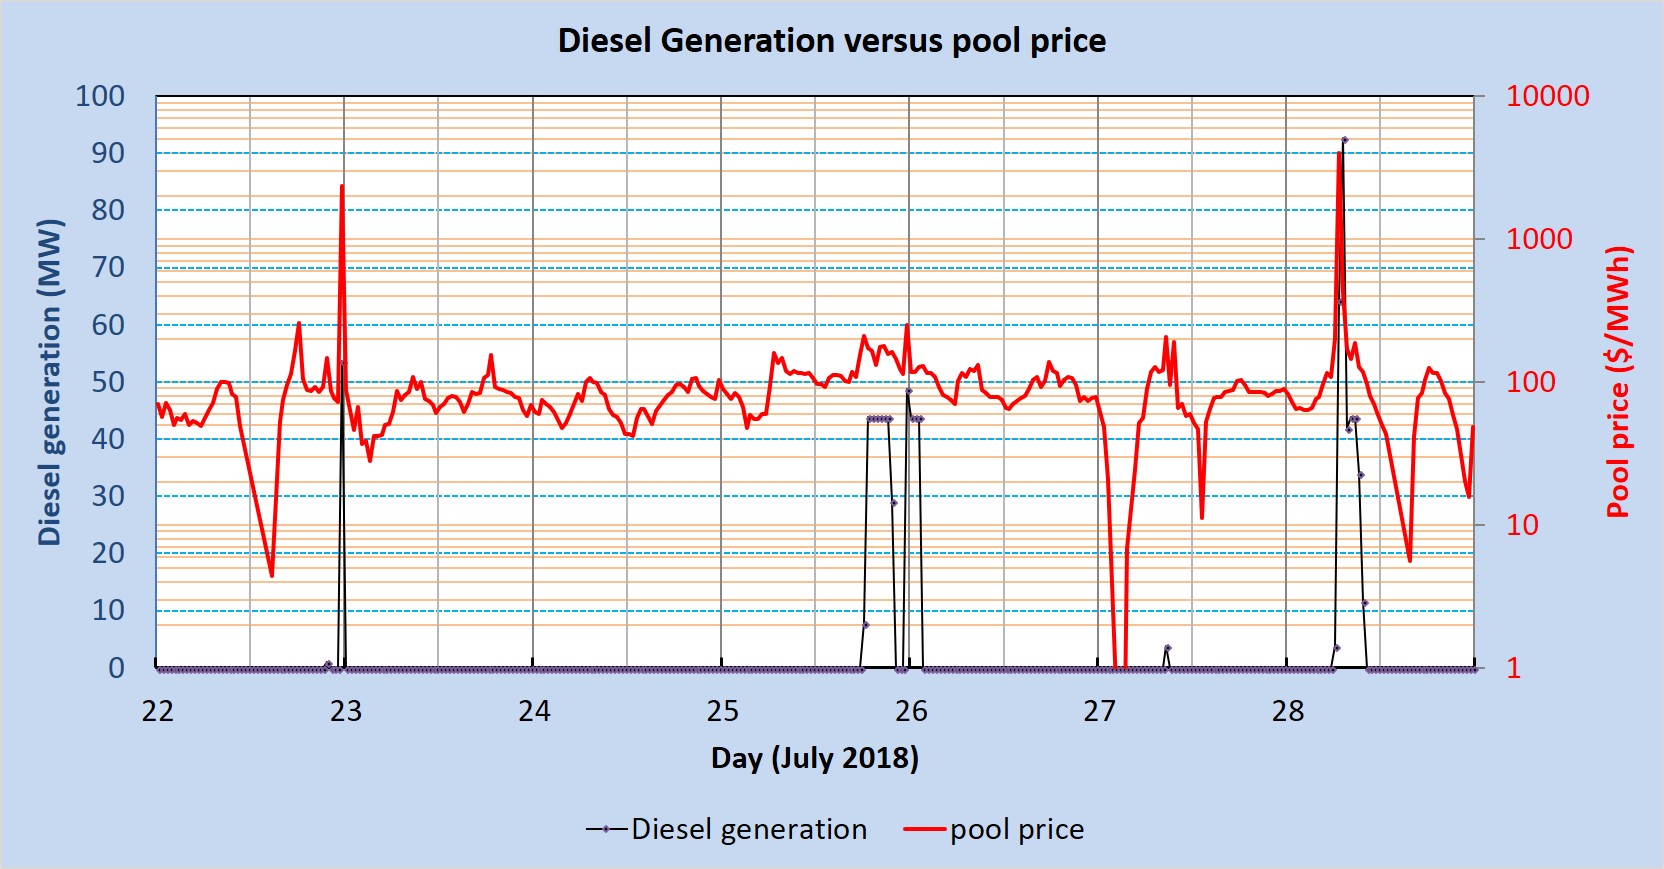 Figure 11 Diesel Daily Generation compared with the pool price (Data Source: NEMReview)
Figure 12 shows the generation mix on the 28th July and shows the period when the price spiked to $3,985/MWh at 0700 in the morning. This period is circled in the chart and shows that wind generation and imports dropped to zero at a time of rising demand and significant OCGT and diesel generation was required to meet demand.
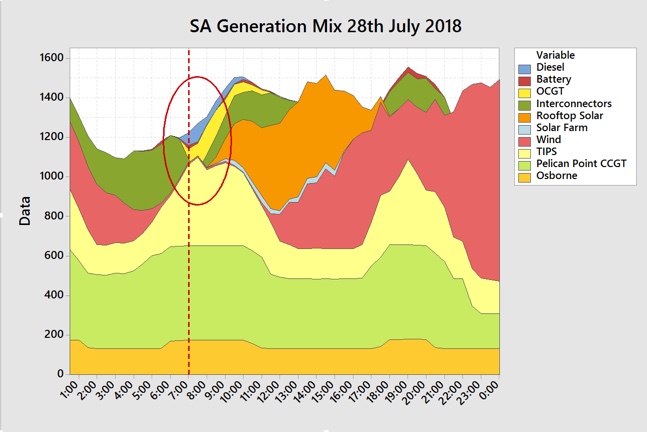 Figure 12 SA Generation Mix 28th July 2018 (Data Source: NEMReview)
The Big Battery (Figure 13) provided support during periods of changes in both the demand and the generation mix, providing some stability to the system.
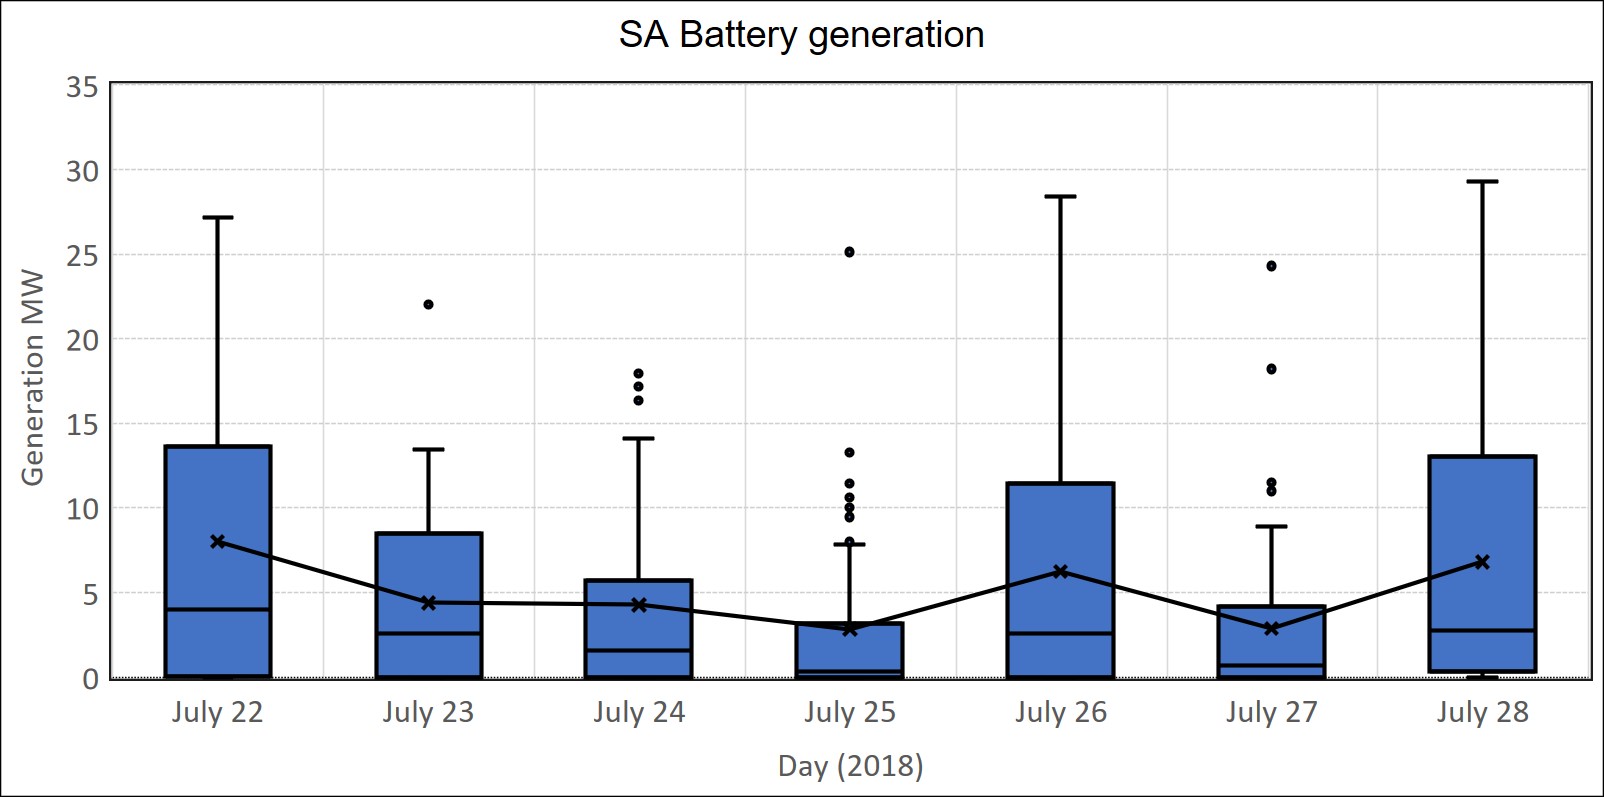 Figure 13 Battery “Generation” Daily Box Plot (Data Source: NEMReview)
In the period July 22nd-24th, South Australia was predominantly exporting electricity to Victoria, as can be seen in Figure 14. From the 25th, South Australia was largely importing electricity during the period of lower wind generation.
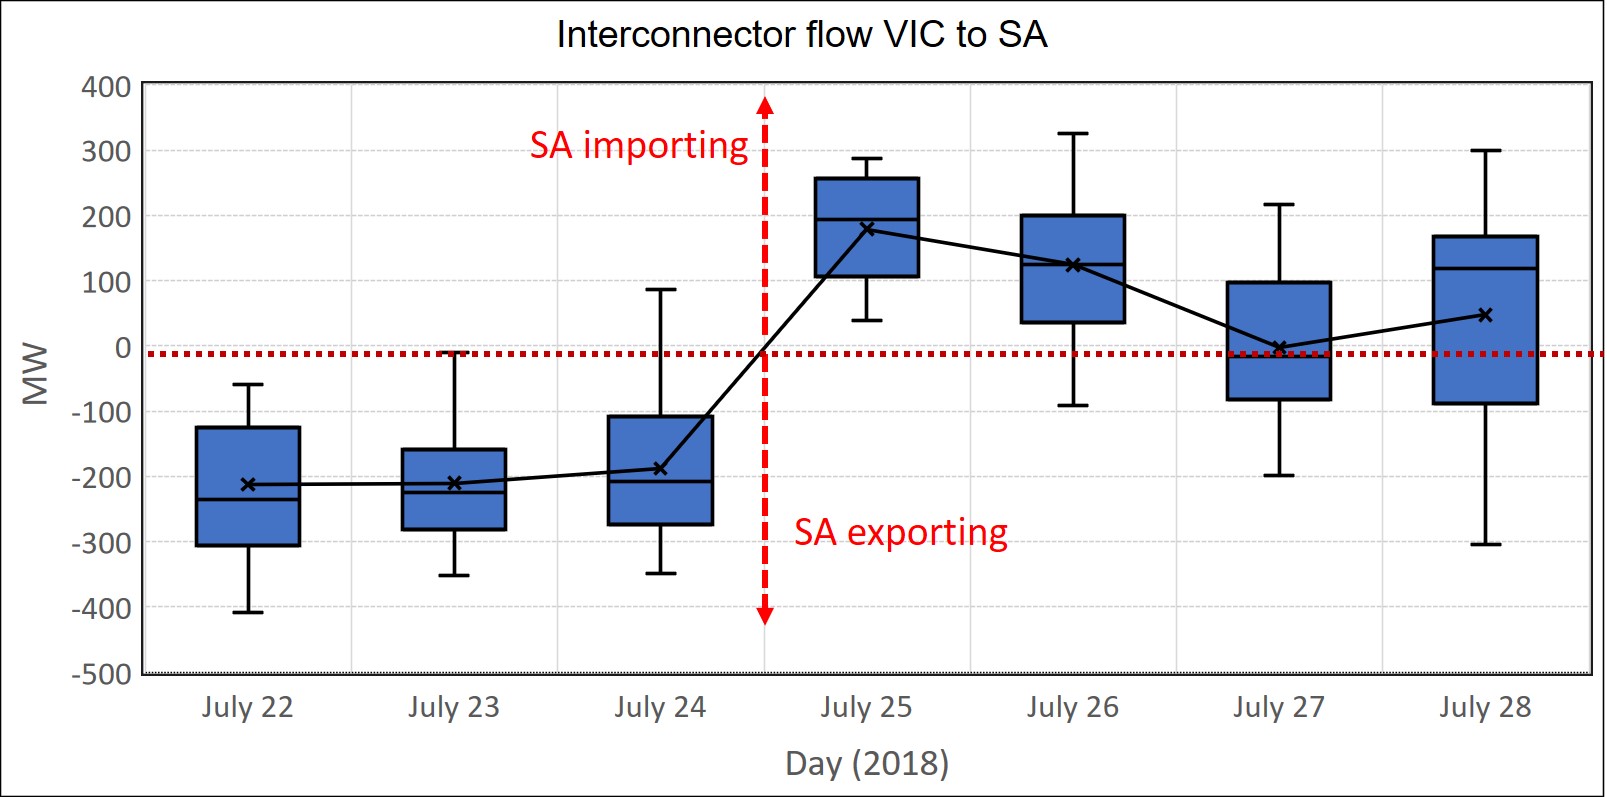 Figure 14 Victoria to South Australia Interconnector Flows Daily Box Plot (Data Source: NEMReview)
Finally, solar played a passive but important role during this week. The calculated rooftop solar (Figure 15) remained largely consistent during the week and contributed several hundred MW of “negative demand” during the peak solar periods in the middle of the day. Without that contribution, several hundred MW would need to have been sought from the not so benevolent generators.
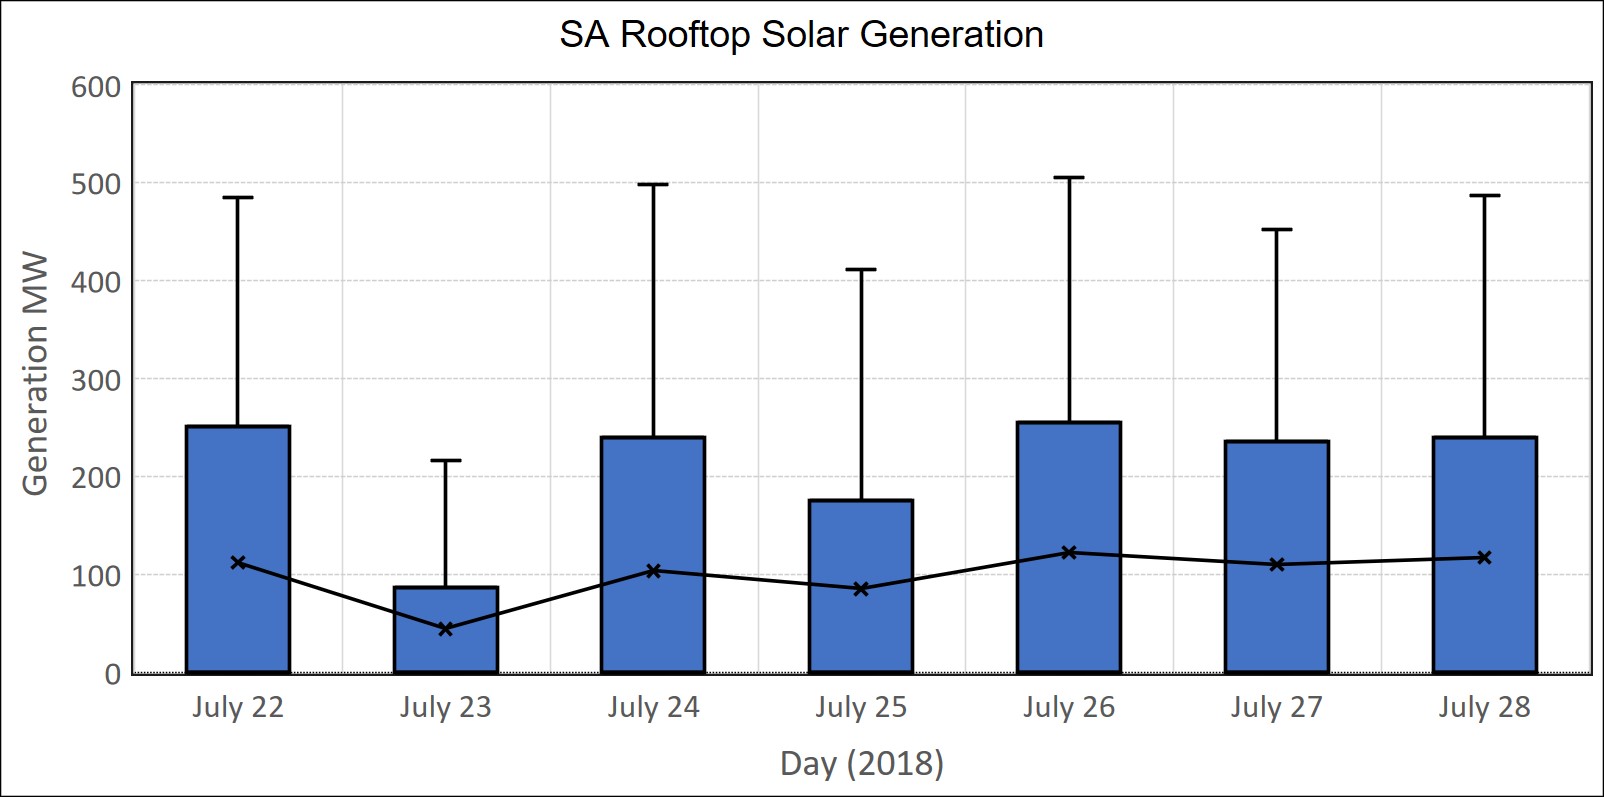 Figure 15 Calculated South Australian Rooftop Solar Daily Generation Box Plot (Data Source: NEMReview)
Since the last post, we have started to include the output from the newly commissioned Bungala One Solar Farm (Figure 16). This farm is producing up to 34 MW during peak solar periods. Probably due to local weather conditions (cloudy), generation was very low on the 22nd, 23rd and 27th.
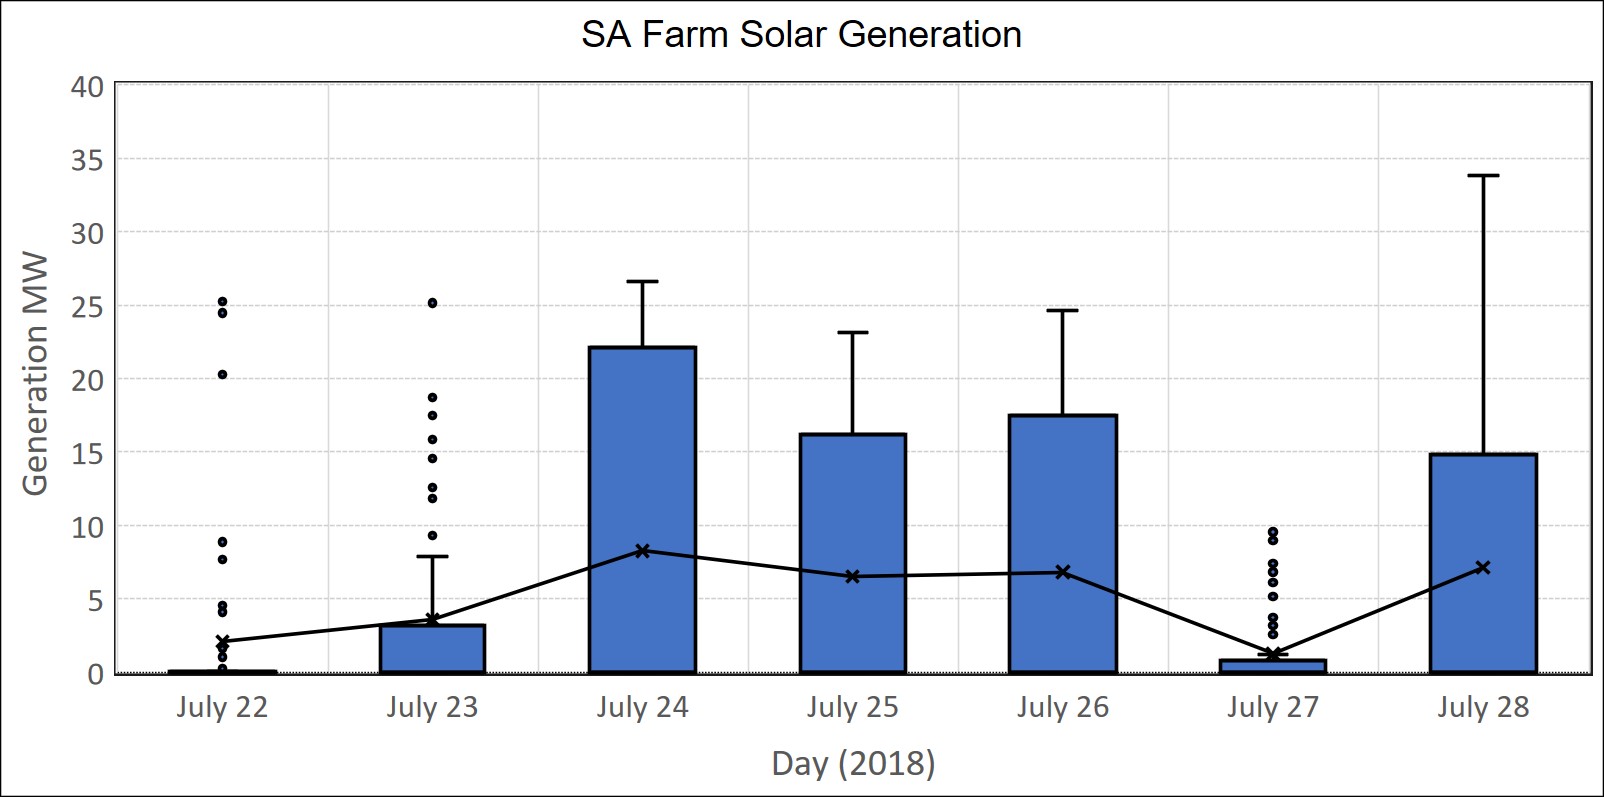 Figure 16 South Australian Farm Solar Daily Generation Box Plot (Data Source: NEMReview)
It should be noted that the solar generation boxplots “boxes” always have their median at zero due to the limited number of solar generation hours during the day.
In summary, the major features of the week were:
- The Osborne Power station restarted on the 24th July
- Pelican Point ran at near capacity from the 25th July
- Wind generation was high during 22nd-24th but dropped to low levels from the 25th
- The combination of no wind generation and very low imports at a time of rising demand in the early morning period on the 28th July resulted in high price OCGT and diesel generation being required to meet demand and a very high price spike.
- The $3,985.64/MWh price spike on the 28th dragged the average price above the median price by $12.34/MWh
Why is it important for end users to understand what is happening in the wholesale electricity market, what drives prices and the price patterns that occur?
It helps end users to understand what is happening to their electricity prices along with the underlying causes so they can make informed decisions.
Those end users who choose to purchase their electricity through wholesale market pass-through prices can gain a better understanding of how they can manage their risk through load shifting and load curtailment (Demand Side Management and Demand Response).
If you would like to understand more about how the electricity market works and how business end-users can reduce their electricity prices then check out my book Power Profits – A Comprehensive 9-Step Framework For Reducing Electricity Costs and Boosting Profits.
If you would an updated SA market weekly report emailed to each week then drop me a line at michael@altusenergy.com.au
